Data &
Technology
Research
Reports
Report Solutions
Reports Library
Actionable
Strategies
Free
Resources
Simple Backtest Calculator
Simple Seasonality Calculator
The Kelly Criterion Calculator
Sentiment Geo Map
Public Research Reports
Free Webinar
Pricing
Company
About
Meet Our Team
In the News
Testimonials
Client Success Stories
Contact
Log inLoginSign up
< BACK TO ALL REPORTS

The Nasdaq goes positive
Jason Goepfert
2020-05-08
The Nasdaq Composite turned positive for the year, after suffering more than a 20% drawdown. This is one of the only times it has clawed back from such a large YTD pullback, especially so early in the year. The big gains in tech have pushed the QQQ fund above the $100 billion market cap threshold, joining few others.

The remarkable run in stocks, primarily tech, pushed enough to turn the Nasdaq Composite positive for the year. That erases a more than 23% decline at its nadir.

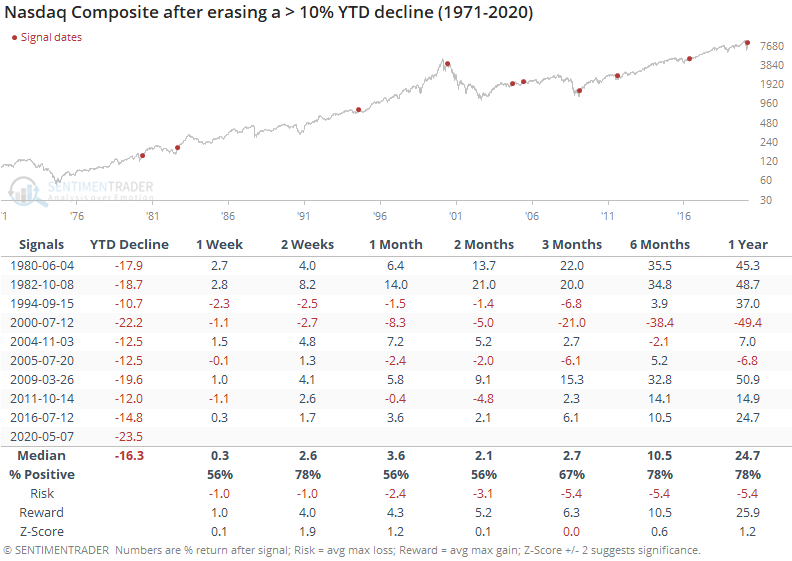
Below, we can see how the index performed following the other times it erased more than a 10% year-to-date decline. Note that these are specifically year-to-date declines, so even if the index was in the midst of a pullback, the return reset to 0 on the first day of each year.

Most fund managers are graded based on calendar returns anyway, and not drawdowns from a peak, so the table will allow us to see if turning positive YTD generated some performance anxiety and a burst of additional buying pressure.

The only time it recovered from a more than 20% decline was in 2000, which wasn't the best signal going forward. Almost immediately after turning positive for the year, it made an about-face and fell into the post-bubble plunge. The only time it recovered from a 10% YTD decline earlier in the year than now was in 2009, which was a great sign for forward returns.

Overall, it showed some mixed performances in the months ahead, with returns about in line with random and a mostly uninspiring risk/reward ratio, especially over the next 1-3 months.

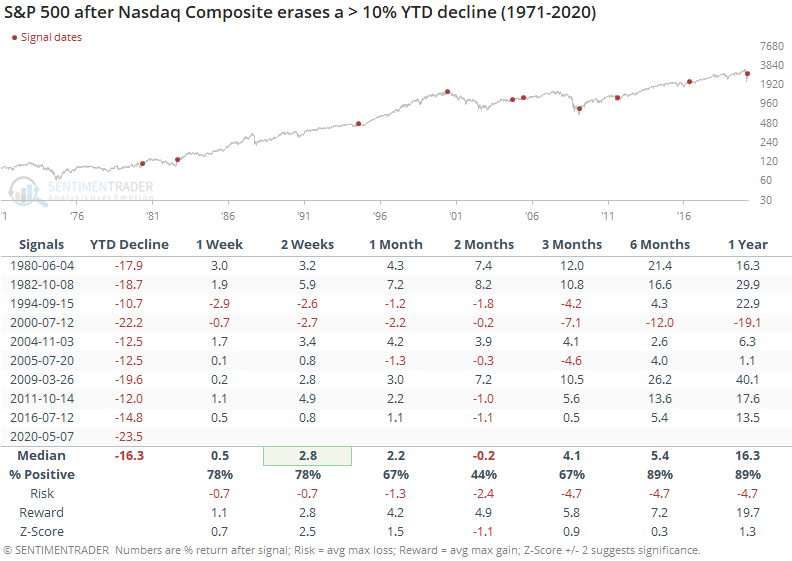
For the S&P 500, the Nasdaq's recoveries were less positive over the next two months, with more losses than gains, even if those losses were small. But over the next 6-12 months, it sported a positive return except for 2000.
The run in tech stocks, particularly the largest ones, have pushed the go-to ETF above a $100 billion market cap.
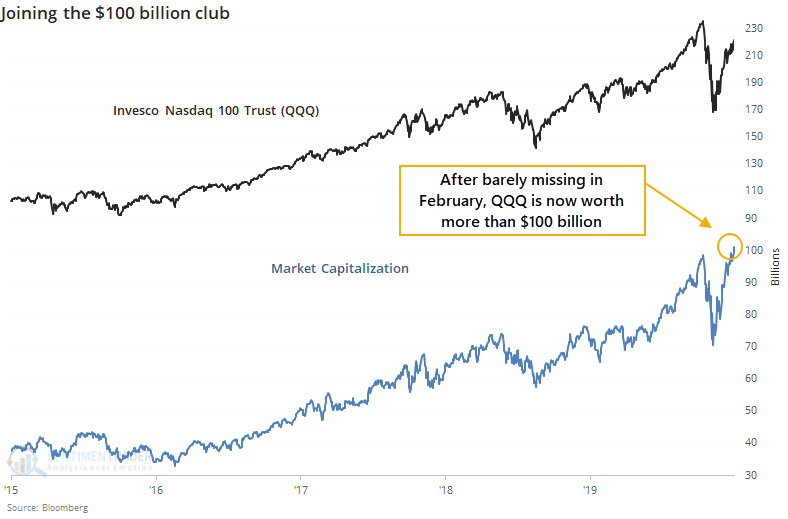
There are only four other ETFs that are in this club, all focused on either the S&P 500 or the broader market. There isn't anything magical about the $100 billion threshold, other than perhaps as a sign of intense interest on the part of investors. It's interesting to note that from 2-4 weeks after the others first surpassed $100 billion, the funds fell back.

That's a slight worry here, along with all the other tech-love sentiment that we're seeing. The fact that tech has turned positive for the year hasn't proved to be a reliable reason to expect further gains, especially over the medium-term. While we're not seeing much that's a screaming sell signal, net positives are getting harder to come by, particularly for tech.

Sorry, you don't have access to this report

Upgrade your subscription plan to get access
Go to Dasboard
DATA &
TECHnologies
IndicatorEdge
‍
BackTestEdge
‍
Other Tools
‍
DataEdge API
RESEARCH
reports
Research Solution
‍
Reports Library
‍
actionable
Strategies
Trading Strategies
‍
Smart Stock Scanner
‍
FREE
RESOUrCES
Simple Backtest
Calculator
Simple Seasonality
Calculator
The Kelly Criterion
Calculator
Sentiment Geo Map
‍
Public Research Reports
‍
Free Webinar
COMPANY
‍
About
‍
Meet our Team
‍
In the News
‍
Testimonials
‍
Client Success Stories
Pricing
Bundle pricing
‍
Announcements
‍
FAQ
© 2024 Sundial Capital Research Inc. All rights reserved.
Setsail Marketing
TermsPrivacyAffiliate Program
Risk Disclosure: Futures and forex trading contains substantial risk and is not for every investor. An investor could potentially lose all or more than the initial investment. Risk capital is money that can be lost without jeopardizing ones’ financial security or life style. Only risk capital should be used for trading and only those with sufficient risk capital should consider trading. Past performance is not necessarily indicative of future results.

Hypothetical Performance Disclosure: Hypothetical performance results have many inherent limitations, some of which are described below. No representation is being made that any account will or is likely to achieve profits or losses similar to those shown; in fact, there are frequently sharp differences between hypothetical performance results and the actual results subsequently achieved by any particular trading program. One of the limitations of hypothetical performance results is that they are generally prepared with the benefit of hindsight. In addition, hypothetical trading does not involve financial risk, and no hypothetical trading record can completely account for the impact of financial risk of actual trading. for example, the ability to withstand losses or to adhere to a particular trading program in spite of trading losses are material points which can also adversely affect actual trading results. There are numerous other factors related to the markets in general or to the implementation of any specific trading program which cannot be fully accounted for in the preparation of hypothetical performance results and all which can adversely affect trading results.

Testimonial Disclosure: Testimonials appearing on this website may not be representative of other clients or customers and is not a guarantee of future performance or success.