The most hated stocks in the world are doing exactly what they should

The most hated stocks are doing what they should
Chinese technology stocks have gone nowhere. And that's precisely what they should be doing.
In September, we looked at the selling cascade in these shares. There was perhaps no corner of the equity market that was more hated or washed-out.
So far, they've done exactly what they're supposed to do by doing nothing at all. Many of them are trading right around the same prices they were a couple of months ago...just like most other significant bottoms.
In September, we took a shorter-term view of several breadth metrics that showed the disaster within stocks in the CSO Overseas China Internet Index, upon which the popular KWEB fund is based. Now we can see that over the past 6 months, the selling pressure has been on par with one of the largest financial disasters of all time.
On an average day over the past six months, fewer than 20% of stocks in that China internet index were trading above their 50-day moving averages. That has now started to curl higher as some of them have recovered.
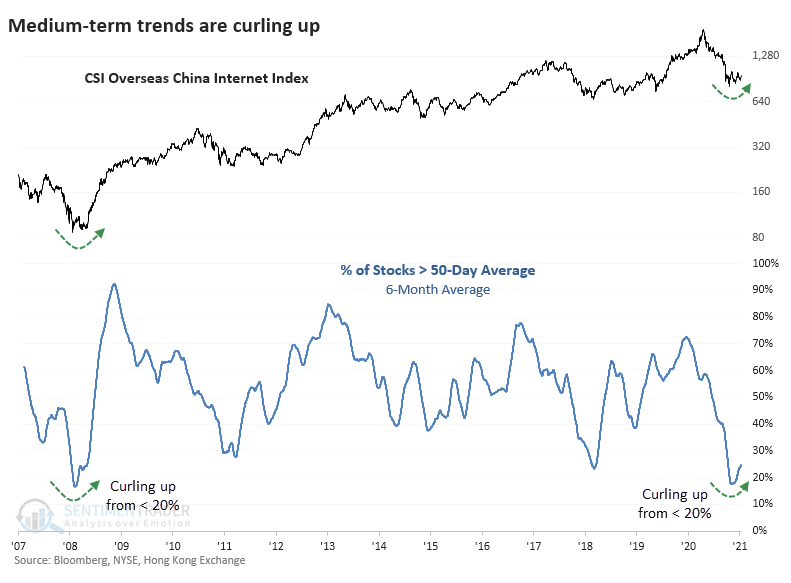
On a longer-term basis, fewer than 15% of the stocks have held above their 200-day moving averages. This average is just now halting its decline and starting to trough, as happened in 2008 and 2011. Other breadth metrics are showing similar patterns.

| Stat box The latest Commitments of Traders report showed that "smart money" commercial hedgers held more than 637,000 contracts net long in 5-year Treasury note futures, the most in 3 years. |
Commodity index hasn't set a low for 400 days
The Bloomberg Commodity Spot Index plunged to a 3-year low in March 2020, and hasn't looked back since. It has now doubled from that low, with its bull market run lasting more than 400 days and counting.
Dean noted that the last time this commodity index went more than 400 days without setting a 1-year low was September 2017, leading to an additional 8 months of higher commodity prices.
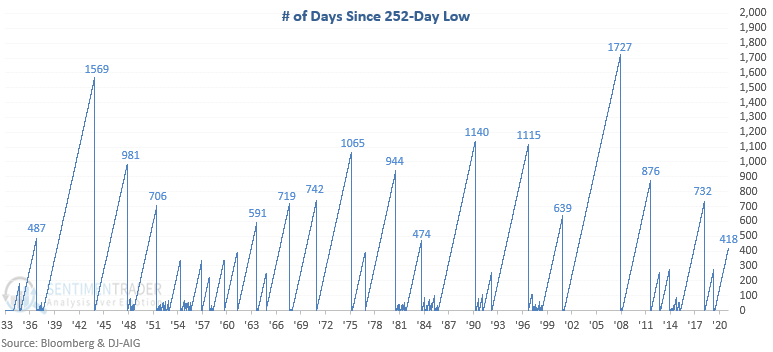
A similar signal has triggered 16 other times over the past 85 years. After the others, future returns and win rates were strong across medium-term time frames.

Timing Growth versus Value
Some arguments among investors never seem to end. Stocks versus bonds. Large-caps versus small-caps. Growth versus value. U.S. domestic versus international. The list goes on.
At any given point in time, pundits and individual investors will make intelligent, impassioned arguments of why their favored investment is the place to be. The reality is, sometimes these arguments are correct, and sometimes they are wrong. The other fact is that no investment style argument is ever settled. There is a continuous back-and-forth that takes place in every relationship.
The most successful investors are the ones who can recognize which style is leading now and then focus their attention there while the trend plays out over time. Let's focus our attention on growth stocks versus value stocks.
Jay used monthly total return data for the S&P 500 Growth Index and the S&P 500 Value Index starting in January 1975 to look at this relationship. The chart below shows the cumulative growth of $1 invested in Growth versus Value since 1975.
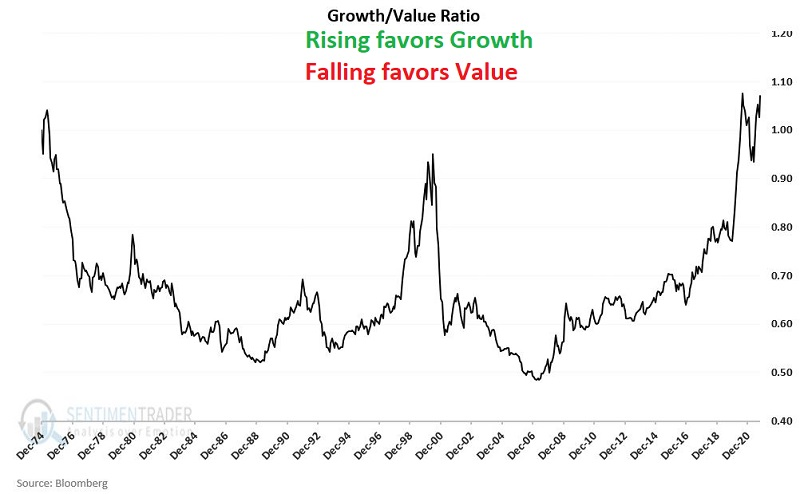
The chart suggests that it is a mistake to assume that one investment style has or will ever establish a permanent advantage over the other. The back-and-forth swings are large and relatively cyclical.
We can use a simple long-term trend-following approach to switch between the two, which has greatly outperformed a buy-and-hold strategy.

Et cetera
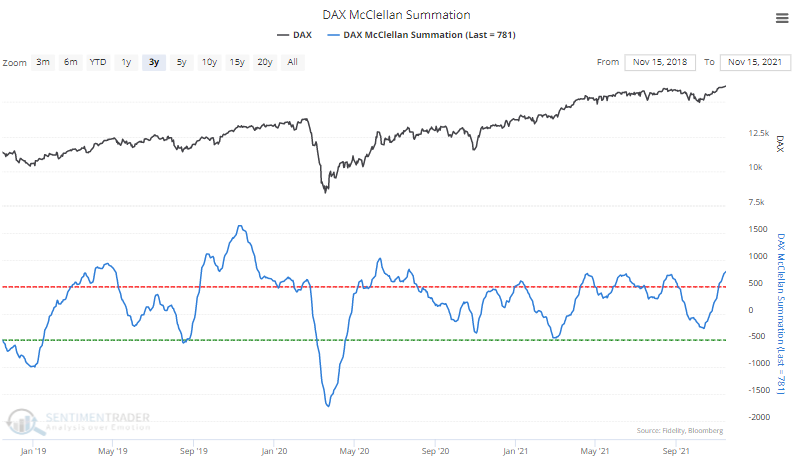
German precision. The McClellan Summation Index, a reflection of internal breadth momentum among stocks traded on the German DAX, has crossed above +750 and is at its highest point in a year.