
The Morning After

This Note is open to all subscribers.
It's safe to say that the vote in the U.K. was a surprise to the majority of investors and markets are reacting in kind. So far this is shaping up to be a "shock" day that we've discussed at length in the past and we'll have more on that later depending on how trading activity unfolds during the day.
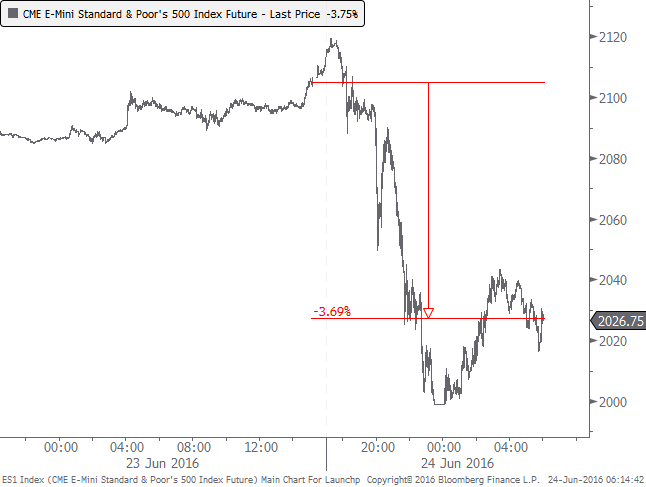
Markets are swinging wildly, with the S&P 500 futures at its limit-down price for a brief period. They rallied 40 points from the low but are currently down more than 3.5% from the prior close.
Assuming the S&P will open down at least 3%, today would mark one of the largest negative opening gaps in the history of the futures dating to 1982. Let's take a look at the other gaps of -3% or more.
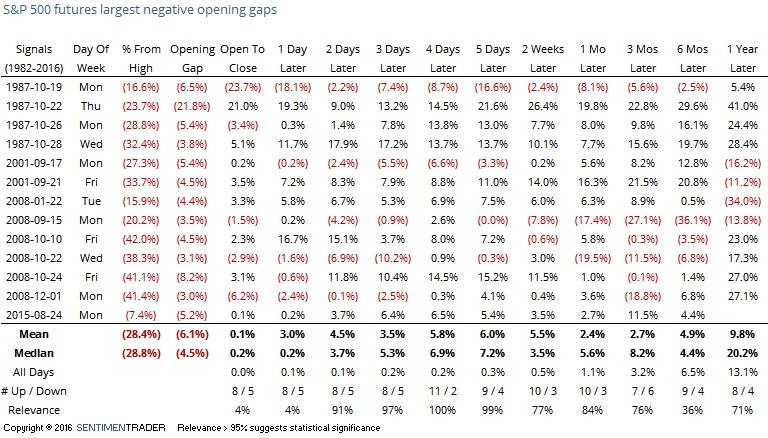
Of the 13 instances, 3 occurred on a Friday. From the open to the close on each of those days, the S&P rallied at least 2%. Rallies were less successful on other days of the week, though of course it's hard to read much into a sample size of three.
The best short-term results were buying the open and holding for four days. In those cases, the S&P showed a positive return 11 of the 13 times averaging nearly 7%. During those four days, the S&P averaged a loss of a 3.7% at its worst point before rallying (not shown in the table), while it gained an average of 8.1% at its best point.
Our current occurrence is unique in a number of different ways, not least of which is the proximity to a one-year high. The S&P closed on Thursday within 2% of its prior peak, while no other instances were within even 7% of a high.
If we use SPY instead of the S&P 500 futures, we get a few more instances (Oct 1997, Jan 1999, Feb 2009 and Sep 2011).
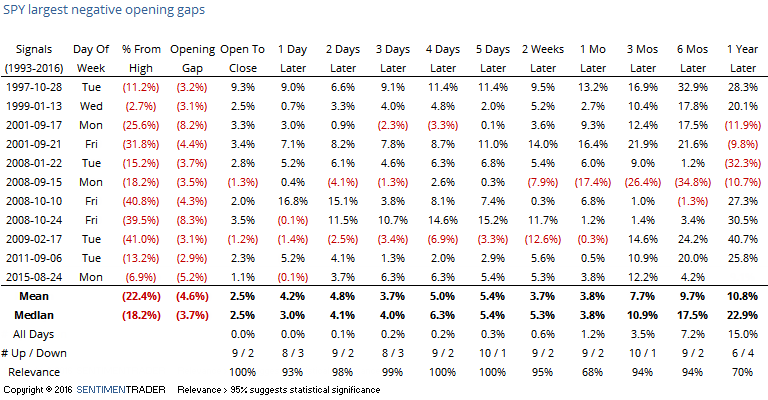
The results were still extremely positive when looking out over the next several days in particular. From the open to five days later, there were 10 rallies out of 11 occurrences. Six of them saw no more than a 1% loss from the open of the gap down through the next week, though the others saw losses of between 2.7% and 7.1%, so it's not like there was no risk.
The closest comparison among these was in January 1999 when Brazil devalued its currency. SPY was within 3% of its 52-week high and yet gapped down more than 3% at the open. That was essentially the low and it did nothing but rally over the next six months.
The situation this morning is highly fluid and will likely change before the open but based on the simple premise that large gap down opens are emotional, the rare times we've seen them as large as this morning have tended to lead to higher prices over the next 3-5 days and that tendency has been strong when it occurs late in the week and when close to a 52-week high. The biggest danger, of course, is that this is truly a Black Swan and investors will be thrown so off kilter that it promotes a selling stampede. If we're going to rally, then we should not see a lower intraday low past 11am or so. If we do, we'd be less inclined to assume that we'll close well, and that would also increase the possibility of another large gap down on Monday.