The months ahead in a pre-election year
Key points
- Seasonality may still provide a boost for stocks in the months ahead
- If it is going to help, it should start soon (or else)
- March through July of pre-election years have been particularly favorable for Nasdaq stocks
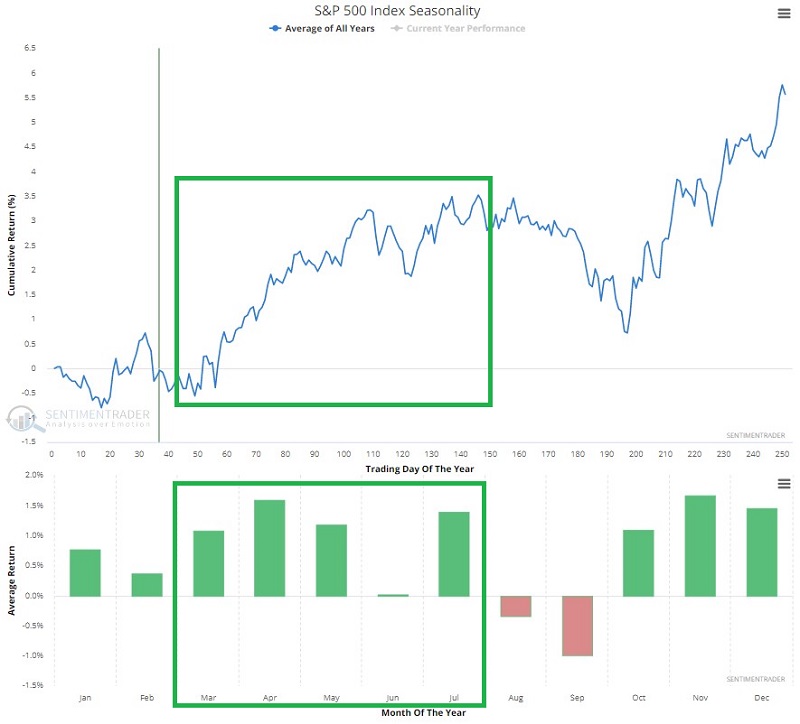
Stocks typically show strength from March through July - especially during pre-election years
The chart below displays the annual seasonal trend for the S&P 500 Index. Note the typical favorability during the March through July period.

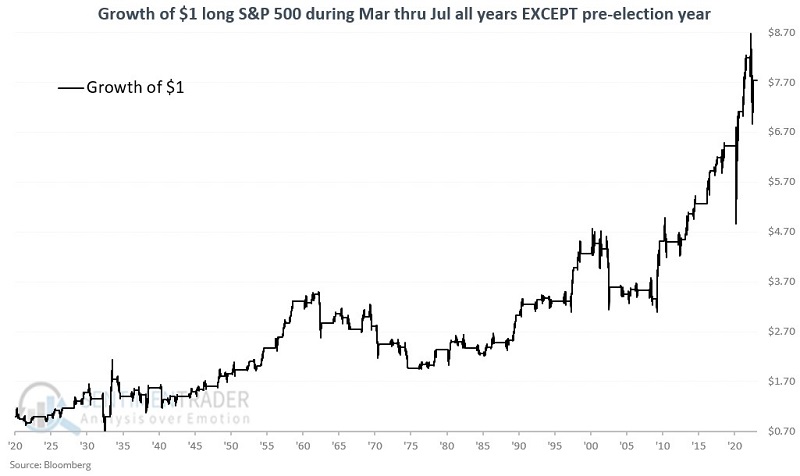
Long-term tendencies aside, it is essential to remember that results can vary widely yearly. In addition, there is an interesting quirk regarding the election cycle. To illustrate, let's first look at S&P 500 March-July performance during non-pre-election years.
The chart below displays the growth of $1 invested in the S&P 500 Index only during March through July of all post-election, mid-term, and election years starting in 1920.
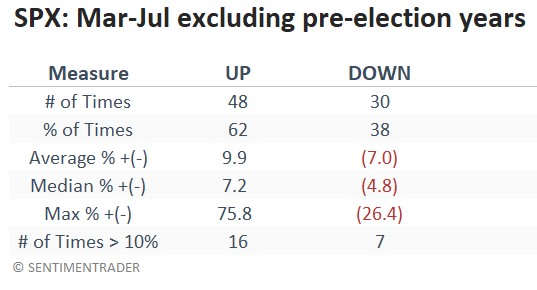
The table below summarizes performance.
Now let's focus only on pre-election years. The chart below displays the growth of $1 invested in the S&P 500 Index only during March through July of each pre-election year starting in 1923. The table below the chart summarizes performance.
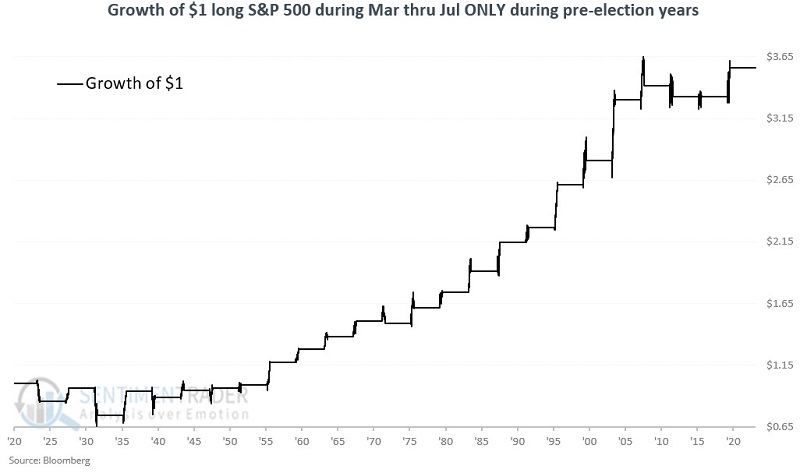
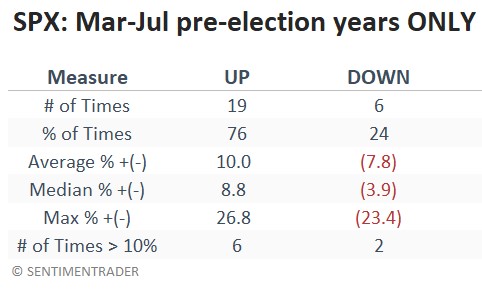
Note that during pre-election years the March-July winning percentage rises from 62% to 76%, and the median up year improves from +7.2% to +8.8%. Another thing to note is that since the start of the 1940s March-July pre-election year performance has been much better. During the 1920s and 1930s, there were two wins and three losses.
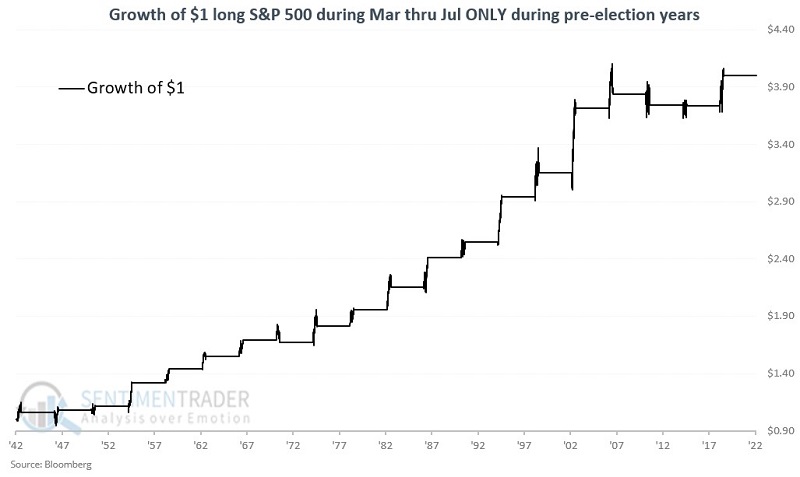
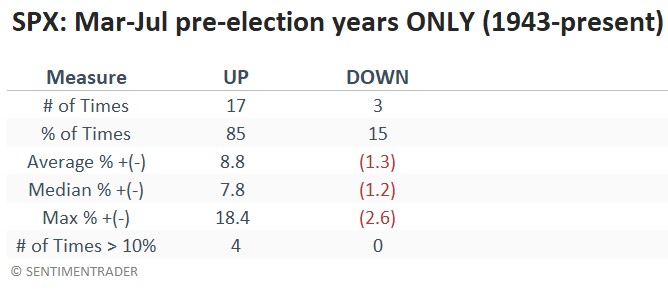
The chart and table below highlight S&P's March-July pre-election year performance starting in 1943. Performance has been noticeably consistent over the past 80 years (85% Win Rate, four gains over +10%, and a maximum decline of only -2.6%).
The Nasdaq has performed even better
For the following test, we will use the Nasdaq Composite Index from 1971 to 1985 and the Nasdaq 100 Index after that. For brevity, we will refer to this as the "Nasdaq."
The chart below displays the growth of $1 invested in the Nasdaq only during March through July of each pre-election starting in 1971. The table below the chart summarizes performance.
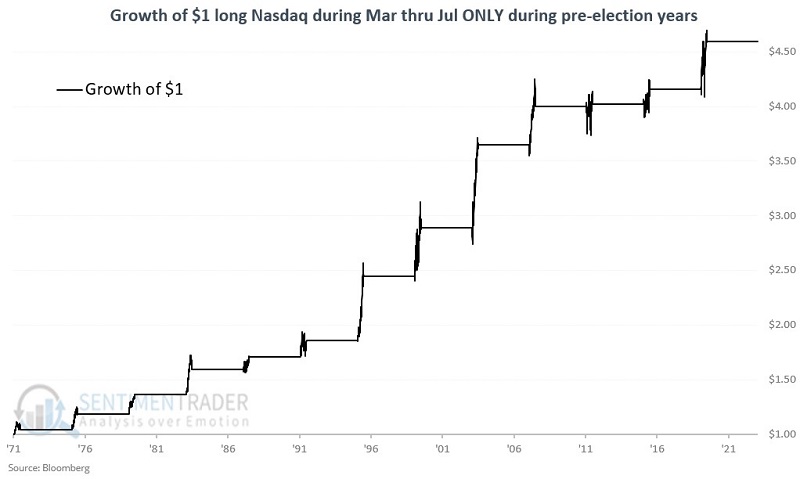
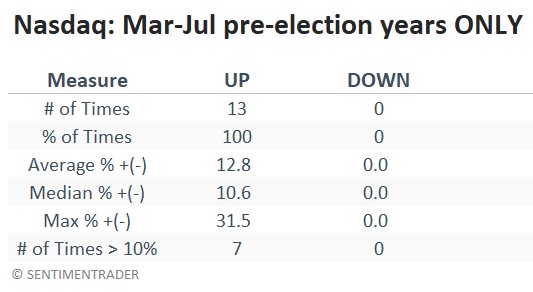
The good news is obvious. In 50 years, the Nasdaq has not experienced a loss during March-July of a pre-election year. The average and median gain has been double digits. The bad news is none of this guarantees an advance for the Nasdaq during this period for 2023.
For those who want to consider a seasonal play, the most straightforward approach would be buying shares of the Invesco QQQ Trust Series 1 (ticker QQQ), which tracks the Nasdaq 100 Index. Traders should remember, however, that seasonal favorability does not relieve an individual investor of their responsibility to allocate capital wisely and manage risk once a position is entered.
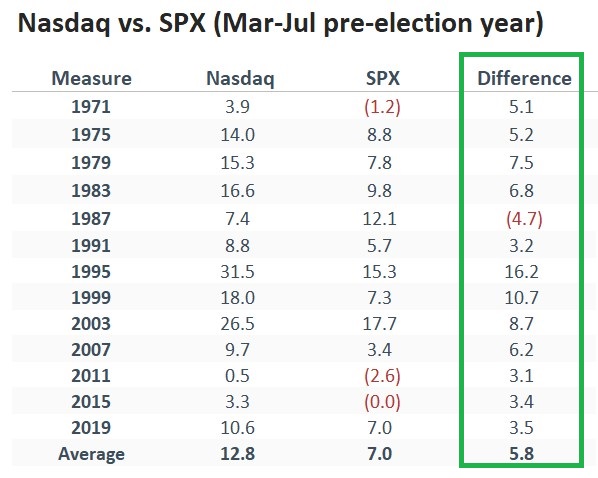
The table below displays the March-July of pre-election year returns for Nasdaq versus SPX and shows the difference in the right-hand column. Only once in 13 times did the S&P 500 outperform Nasdaq during this period.
For comparison, the chart below shows the growth of $1 in Nasdaq divided by the growth of $1 in SPX during this five-month period that occurs once every four years.
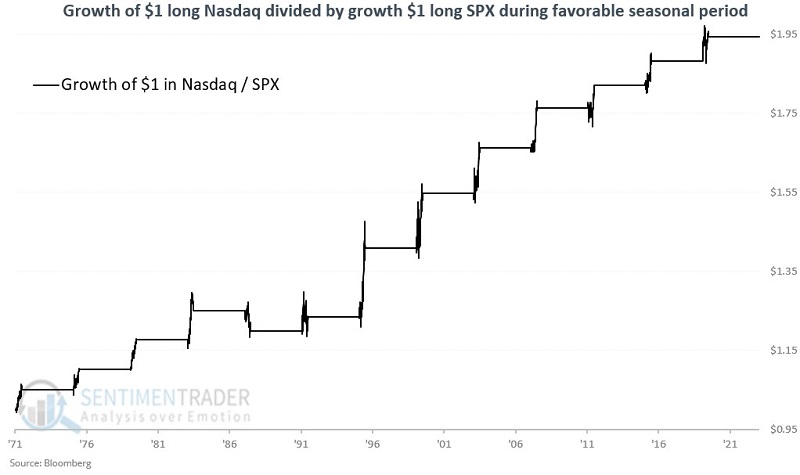
The bottom line: If the S&P 500 Index outperforms the Nasdaq 100 Index over the next five months, it will be quite an anomaly versus the past 50 years.
What the research tells us…
The stock market has demonstrated a long history of performing well during pre-election years. Often, the "meat" of that performance occurs during the March through July time frame - particularly for Nasdaq stocks. The caveat remains that seasonality only tells you "where" to look. It is never a guarantee of performance. All seasonal bets are off if the major stock market indexes break down below their longer-term moving averages and stay there. However, as long as the major stock market indexes hold above their longer-term moving averages, history strongly suggests giving the bullish case the benefit of the doubt. History also suggests keeping a close eye on the Nasdaq 100 Index.

