
The McClellan Oscillator for the S&P 500 rebounds to positive territory

Key points:
- The McClellan Oscillator for the S&P 500 closed below zero for 20 straight sessions before shifting higher
- Similar breadth-based reversals near a high saw the S&P 500 rise over the next three months
- The S&P 500 Equal-Weighted Index consistently outperformed the S&P 500, albeit by a slight margin
A market breadth indicator shifts from a bearish to a bullish condition
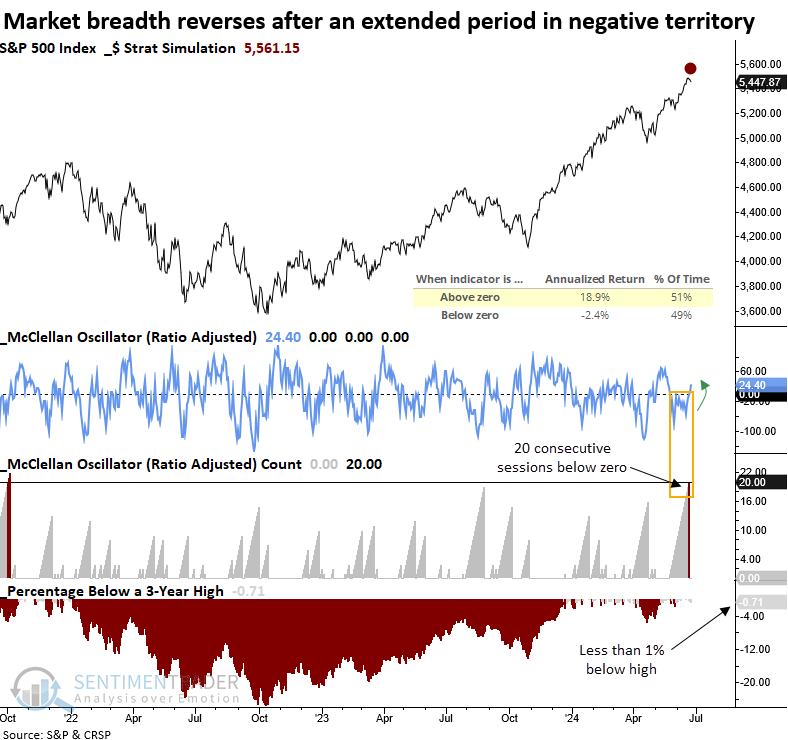
The McClellan Oscillator, a breadth-based indicator developed by Sherman and Marian McClellan, which subscribers can follow on our website for several indexes, utilizes advancing and declining issues to assess the trend of market breadth.
According to the McClellan's, "When the Oscillator is positive, it generally portrays money coming into the market; conversely, when it is negative, it reflects money leaving the market." As the chart below shows, since 1928, the S&P 500 has displayed an annualized return of 18.9% when above zero (positive) and -2.4% when below zero (negative).
Recently, the McClellan Oscillator fell below zero, indicating a negative trend for breadth, and remained below that level for 20 consecutive trading sessions, a condition that has taken place 95 times since 1928. However, almost all precedents occurred during corrections and bear markets, not when the S&P 500 resided less than 1% below a high like now.
For only the eighth time since 1928, the McClellan Oscillator closed below zero for 20 successive sessions or more and reversed above zero as the S&P 500 resided within 1% of a 3-year high. The previous instance occurred in 2017 during a low-volatility uptrend, an environment similar to now.
Similar breadth-based reversals preceded positive returns
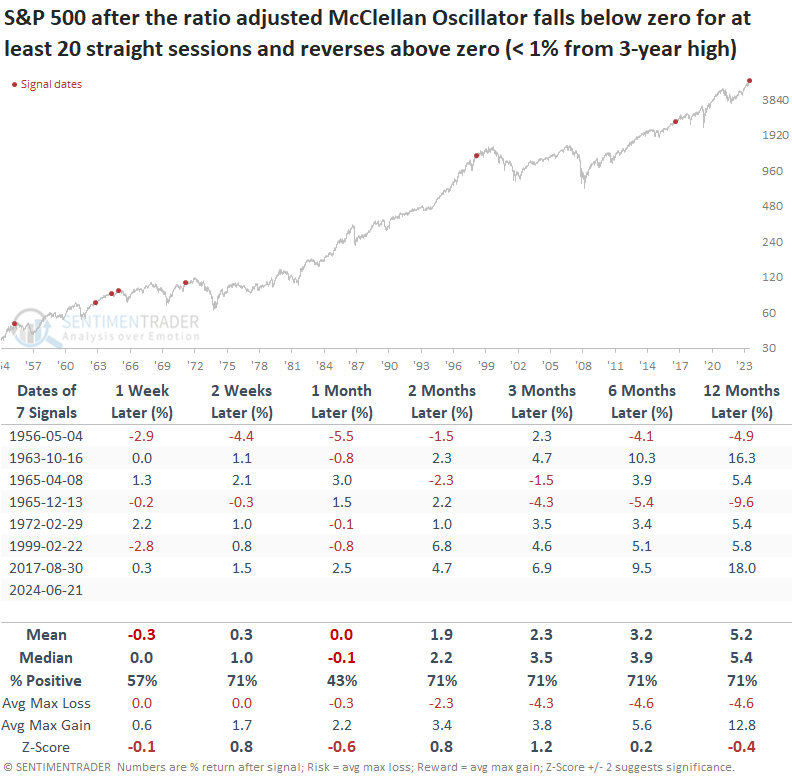
While the sample size is small, when the McClellna Oscillator closed below zero for 20 consecutive sessions or more and subsequently reversed above zero with the S&P 500 index less than 1% below a 3-year high, the world's most benchmarked index showed mixed results over the following month.
At some point over the next three months, the S&P 500 achieved a gain every time. More importantly, the month-long period with negative breadth did not foreshadow an imminent market peak. Most likely, it represented sector rotation under the surface of the index.
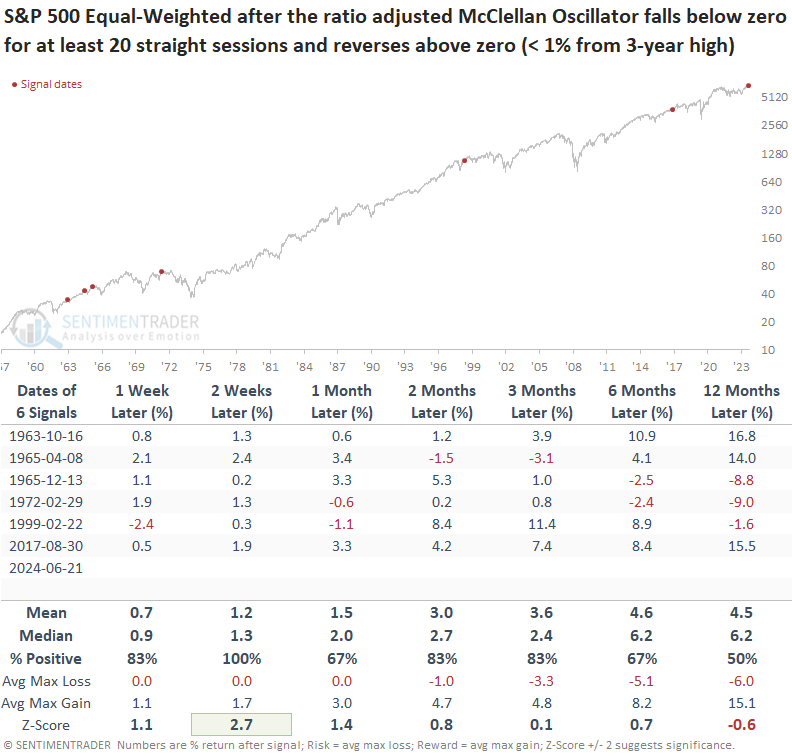
Despite one less signal due to data limitations, the S&P 500 Equal-Weighted Index, which weights each stock equally, displayed a consistent bullish upward trajectory over the following six months.
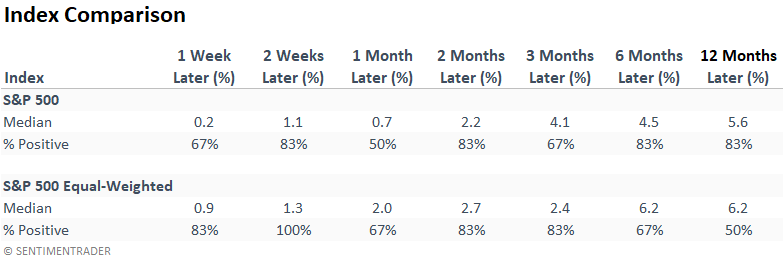
When comparing the two index weighting methodologies on an equal basis by excluding the 1956 signal, the median return for the S&P 500 Equal-weighted Index surpasses the median return for the S&P 500 in all but one horizon.
What the research tells us...
After remaining in negative territory for 20 sessions, the McClellan Oscillator, a breadth-based indicator, rebounded into positive territory, indicating an improvement in stock participation. Similar reversals led to gains at some point for the S&P 500 over the following three months every time. Typically, the S&P 500 Equal-Weighted Index displayed a slight edge over the S&P 500.
Broadly speaking, participation has not been ideal lately, as we've shared in several notes. Investors have crowded into a handful of mega-cap Technology stocks at the expense of the average stock. With indexes hovering near highs, the participation problem is most likely sector rotation under the surface rather than some sort of systemic problem. i.e., it's more like 2017 and not 1999.