
The McClellan indicators join the breadth parade

Key points
- The McClellan Oscillator uses NYSE advance/decline data to identify extreme buying and selling in the market
- The McClellan Summation Index uses the daily McClellan Oscillator values to identify the market trend as well as extreme strength and weakness
- Both indicators recently gave signals in the same direction
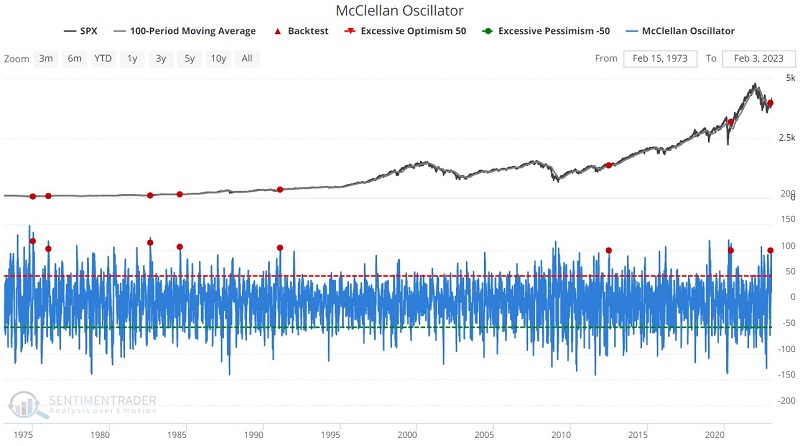
A brief overview of the McClellan Oscillator
The Oscillator is based off work pioneered by Sherman and Marian McClellan and is currently carried on by their son Tom (search the web for "McClellan Oscillator" for more background). It is essentially a look at the momentum of the underlying breadth of the market. When it is above zero, momentum is positive; below zero is negative. Many traders will use the oscillator as an overbought/oversold indicator. However, in many cases, a high reading serves as a breadth thrust indication and can signify a sustainable rally. Like many indicators, the reality is that there are many different ways to use and interpret its fluctuations.
Assessing upwards thrusts by the McClellan Oscillator
For the first test, we run the Backtest Engine to identify those times when the indicator crosses above 90.9, including any overlapping signals. The table summarizes S&P 500 performance following these signals.
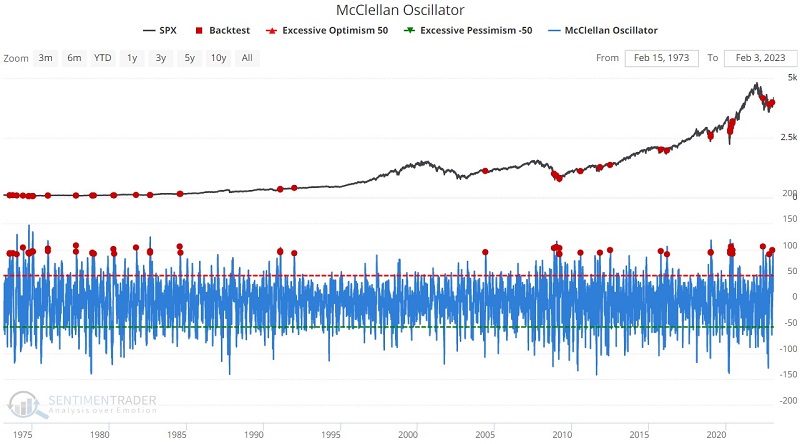
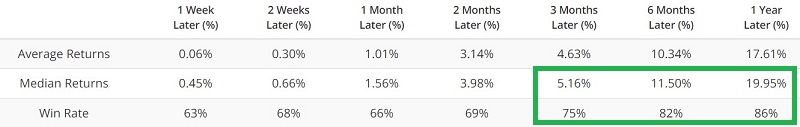
Results are quite positive, albeit with some "too early" signals in 1973-74 and 2008-09. The most recent signals occurred in May and October of 2022 and again on 2023-01-12.
For the next test, we look for an even more extreme reading and identify those times when the indicator crosses above 98.9, once again including any overlapping signals.
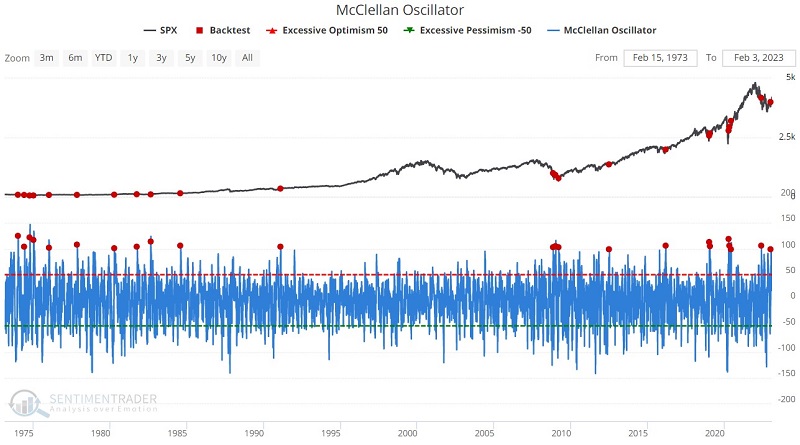
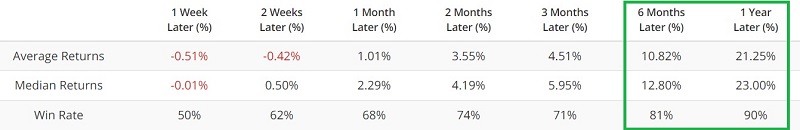
This refinement cuts the number of signals almost exactly in half (from 59 to 30). Interestingly, even though this signal requires what some would consider an even more overbought reading, the median twelve-month gain and the Win Rate are higher than with the first test. Again, this demonstrates the potential power and significance of a breadth thrust. This version did not trigger in October of 2022, but did give an early signal in May 2022 and a more recent signal on 2023-01-12.
Adding a price trend filter
For the next iteration, we run the same test but add the requirement that the S&P 500 must be above its 100-day moving average at the time of the McClellan Oscillator signal for it to be counted.
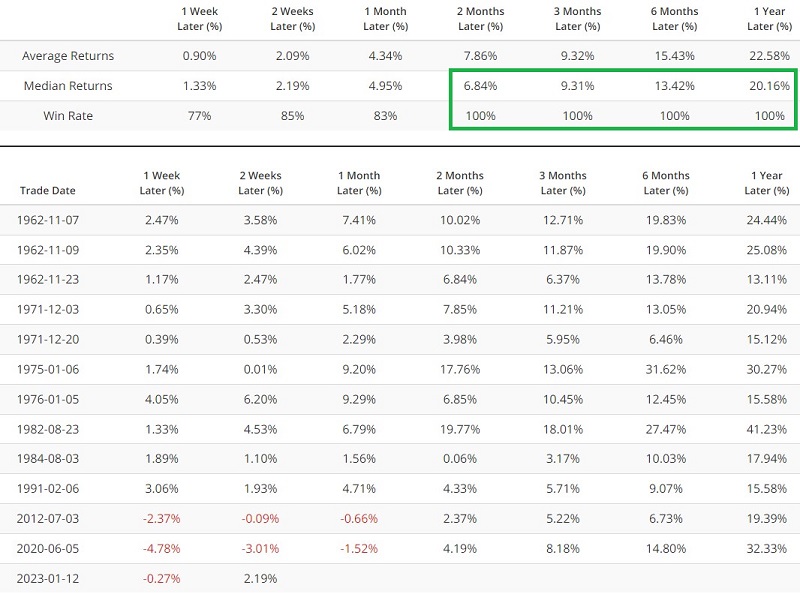
The price filter refinement cuts the number of signals down to twelve and slightly reduces the Median Return. On the plus side, the historical Win Rate for this particular iteration is 100% for two months out to 12 months (which does not guarantee that the latest signal on 2023-01-12 will show a gain twelve months from now). Still, this is an enticing setup for traders who prefer to trade in the direction of the major trend.
A look at the McClellan Summation Index
This indicator gives a longer-term look at the momentum of the underlying breadth of the market by adding each day's McClellan Oscillator reading that to the day before. For more details, see here.
While the two McClellan indicators stand alone, it is often meaningful when they both give favorable signals within a short period of time from one another. The test below identifies those times when the McClellan Summation Index crosses above 1,000 for the first time in twelve months.
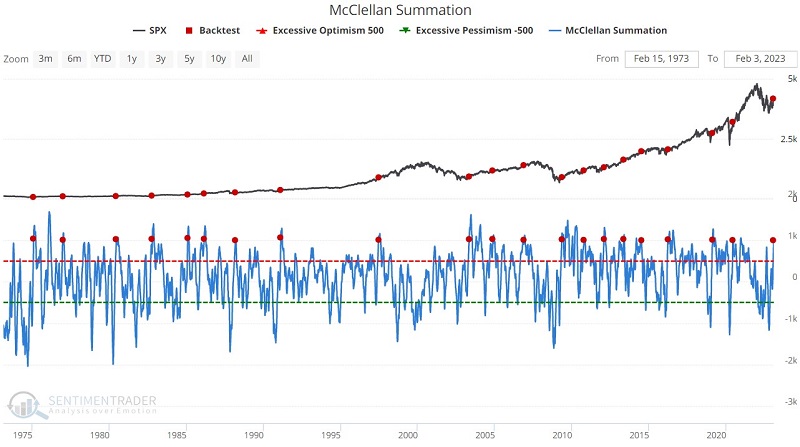
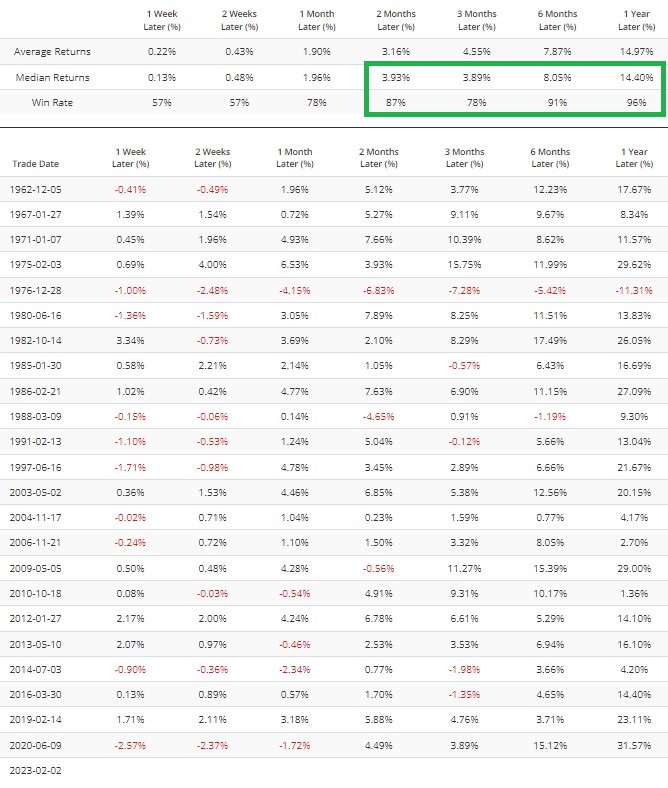
22 of 23 previous signals saw the S&P 500 gain ground over the ensuing twelve months. The one losing signal occurred on 1976-12-28 and was followed by a twelve month decline of -11.31%. The most recent signal occurred on 2023-02-02 and confirms the recent signals from the McClellan Oscillator highlighted above.
What the research tellsus…
A rocket ship leaving the launching pad is the best analogy for a breadth thrust. It takes a lot of energy to get it moving, but once it takes off, the upward momentum can carry it a long way. Historically, a breadth thrust is one of the most favorable things that can happen for the stock market. That said, with the premature rallies seen in 1973-74 and 2008-09 firmly in mind, the best advice for stock investors is still "hope for the best, prepare for the worst."