Data &
Technology
Research
Reports
Report Solutions
Reports Library
Actionable
Strategies
Free
Resources
Simple Backtest Calculator
Simple Seasonality Calculator
The Kelly Criterion Calculator
Sentiment Geo Map
Public Research Reports
Free Webinar
Pricing
Company
About
Meet Our Team
In the News
Testimonials
Client Success Stories
Contact
Log inLoginSign up
< BACK TO ALL REPORTS

The Market "Un-Splits" As Momentum Is Relentless

Jason Goepfert
2020-01-10
The HiLo Logic Index shows an un-split market, and momentum has helped stocks hit new all-time highs more than 25 times in 3 months.

An “un-split” market

In November, a main reason for worry was the “split” in the market. On the Nasdaq and then the NYSE, there were an abnormally large number of both winning and losing stocks. When that has happened before, stocks consistently declined over the short- to medium-term. Those warnings failed, and badly.

Since then, the market has become “un-split” as there are few remaining losing stocks. Now, it’s almost all winners. That has pushed the HiLo Logic Index to a very low level.

NYSE HiLo Logic Index

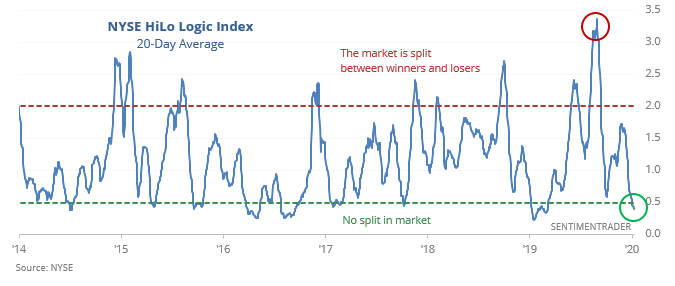
When the 20-day average of the HiLo Logic Index is below 0.5, annualized returns in the S&P have been excellent, at more than 21%. But when the index first cycles down to a low following following a high one, it hasn't been quite so pristine of an indication.


Relentless rally

If it seems like the S&P 500 is making a new high every day, that's because it has been doing just that. The past 3 months have seen 26 new all-time highs.

S&P 500 new highs past 3 months

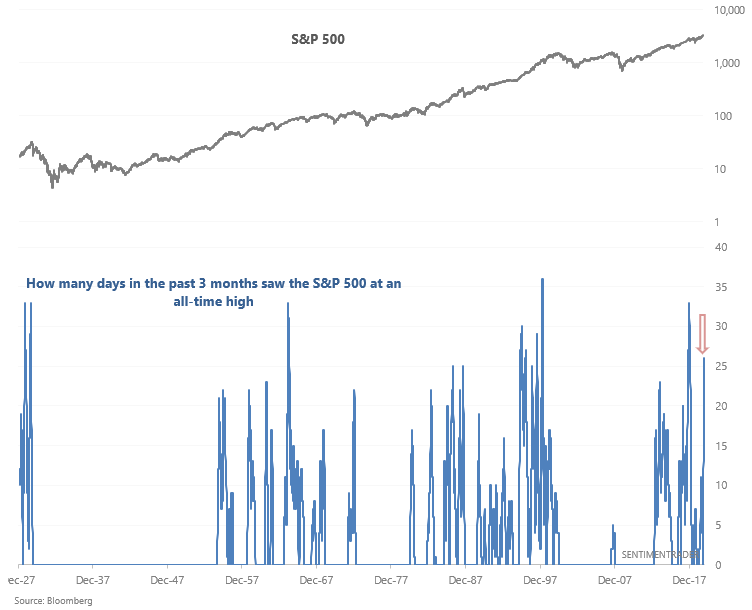
The last time this happened was in late-2017, just as the U.S. stock market began a blow-off top that ended with a crash in January-February 2018. Prior to that, we'd have to go back more than 20 years. And of course the worst such cases were in 1928-1929, which culminated in an epic stock market crash.

Table of S&P 500 after all time highs

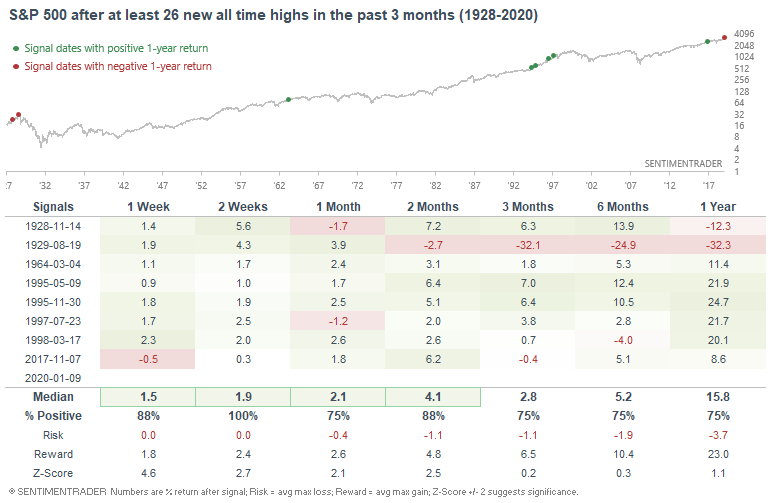
But in the interim, the momentum tended to continue. Even broadening the criteria to get a larger sample size confirms this. Momentum has been the primary reason to not become overly negative among all the metrics we've been following in recent weeks (even months) and it hasn't showed much sign of stopping.


This is an abridged version of our recent reports and notes. For immediate access with no obligation, sign up for a 30-day free trial now.

We also looked at:

  • Bank failures have been historically low for 5 years
  • The S&P 500's Bullish Percent Index (BPI) is breaking out as more stocks reach point-and-figure buy signals
  • What happens when the Fed's probability of recession drops
  • The relative strength index of utilities has plunged
DATA &
TECHnologies
IndicatorEdge
‍
BackTestEdge
‍
Other Tools
‍
DataEdge API
RESEARCH
reports
Research Solution
‍
Reports Library
‍
actionable
Strategies
Trading Strategies
‍
Smart Stock Scanner
‍
FREE
RESOUrCES
Simple Backtest
Calculator
Simple Seasonality
Calculator
The Kelly Criterion
Calculator
Sentiment Geo Map
‍
Public Research Reports
‍
Free Webinar
COMPANY
‍
About
‍
Meet our Team
‍
In the News
‍
Testimonials
‍
Client Success Stories
Pricing
Bundle pricing
‍
Announcements
‍
FAQ
© 2024 Sundial Capital Research Inc. All rights reserved.
Setsail Marketing
TermsPrivacyAffiliate Program
Risk Disclosure: Futures and forex trading contains substantial risk and is not for every investor. An investor could potentially lose all or more than the initial investment. Risk capital is money that can be lost without jeopardizing ones’ financial security or life style. Only risk capital should be used for trading and only those with sufficient risk capital should consider trading. Past performance is not necessarily indicative of future results.

Hypothetical Performance Disclosure: Hypothetical performance results have many inherent limitations, some of which are described below. No representation is being made that any account will or is likely to achieve profits or losses similar to those shown; in fact, there are frequently sharp differences between hypothetical performance results and the actual results subsequently achieved by any particular trading program. One of the limitations of hypothetical performance results is that they are generally prepared with the benefit of hindsight. In addition, hypothetical trading does not involve financial risk, and no hypothetical trading record can completely account for the impact of financial risk of actual trading. for example, the ability to withstand losses or to adhere to a particular trading program in spite of trading losses are material points which can also adversely affect actual trading results. There are numerous other factors related to the markets in general or to the implementation of any specific trading program which cannot be fully accounted for in the preparation of hypothetical performance results and all which can adversely affect trading results.

Testimonial Disclosure: Testimonials appearing on this website may not be representative of other clients or customers and is not a guarantee of future performance or success.