Data &
Technology
Research
Reports
Report Solutions
Reports Library
Actionable
Strategies
Free
Resources
Simple Backtest Calculator
Simple Seasonality Calculator
The Kelly Criterion Calculator
Sentiment Geo Map
Public Research Reports
Free Webinar
Pricing
Company
About
Meet Our Team
In the News
Testimonials
Client Success Stories
Contact
Log inLoginSign up
< BACK TO ALL REPORTS

The Longest Pullback in Almost a Year

Jason Goepfert
2021-10-08
For the first time in over 200 sessions, the S&P 500 has gone 23 days without setting a new high, ending one of its longest streaks without a pullback.

Last August, the S&P 500 did what was unthinkable just a few months prior - it broke out to a new all-time high.

Soon after, stocks saw a bit of a blow-off peak and the S&P didn't regain its highs until November. And it hasn't looked back since. The most protracted pullback that investors suffered was 22 days in June. Until now.

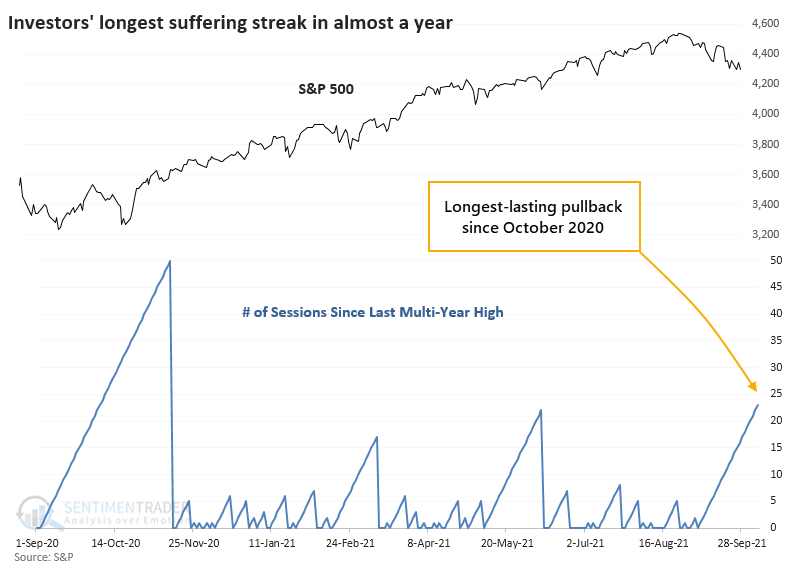
This ends a near-record run with investors not having to suffer more than 22 days without seeing a new multi-year high (not considering bear markets). The only period that exceeded our current run, and that was just barely, ended in February 1955.

For what it's worth, buyers came in immediately after that streak ended, setting a new high the next day, and pushed the S&P 500 higher by a couple of percentage points over the next month. It did suffer some longer pullbacks after that but enjoyed double-digit gains within six months.

That was more the rule than the exception. After other long streaks without a 23-day pullback finally ended, the S&P rebounded during the next three months every time.


What else we're looking at

  • Full returns in the S&P 500 after the first 23-day pullback in more than 90 days
  • What happens after newsletter bulls fall for the first time in more than a year
  • A couple of indicators flashing positive signs for stocks
  • What happens after Financial stocks dominate the new-high list

Stat box

Showing deteriorating long-term internal momentum, the McClellan Summation Index for stocks in the S&P 500 just crossed below zero for the first time since May 2020.

Etcetera

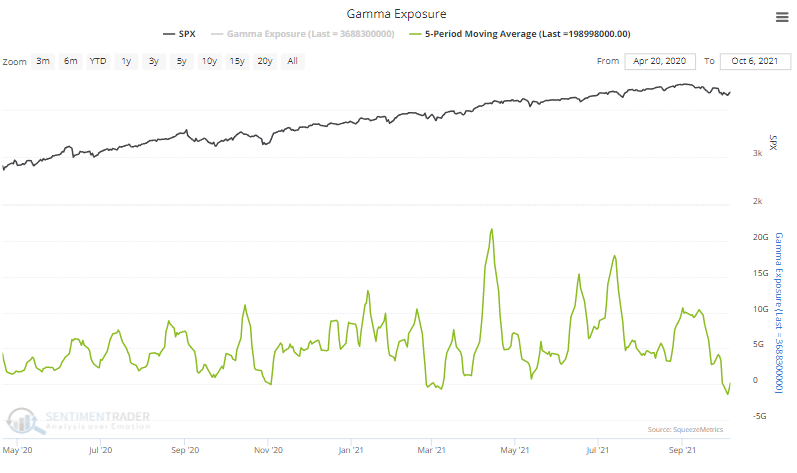
Gamma games. Estimated gamma exposure to the S&P 500 is trying to rise from negative territory. This is a measure of how much stock dealers may have to buy or sell based on option flow. When it's low and rises, stocks tend to rally.

gamma exposure

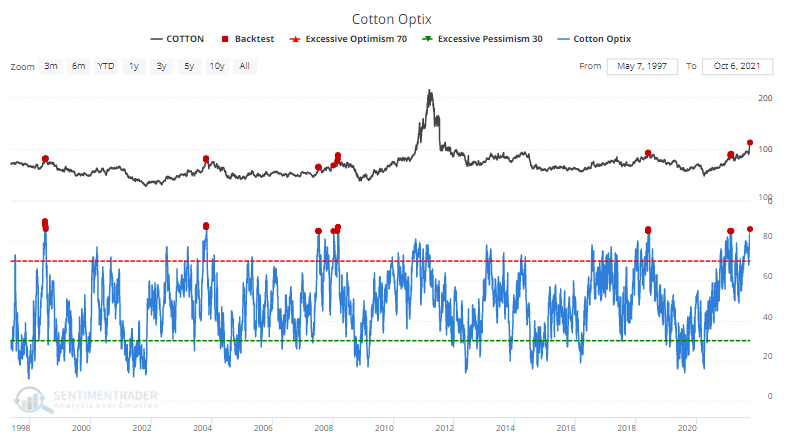
Hard optimism in a soft market. The Optimism Index for cotton just rose to one of the highest levels in its history. The commodity has had a hard time maintaining gains after such enthusiasm.

cotton sentiment

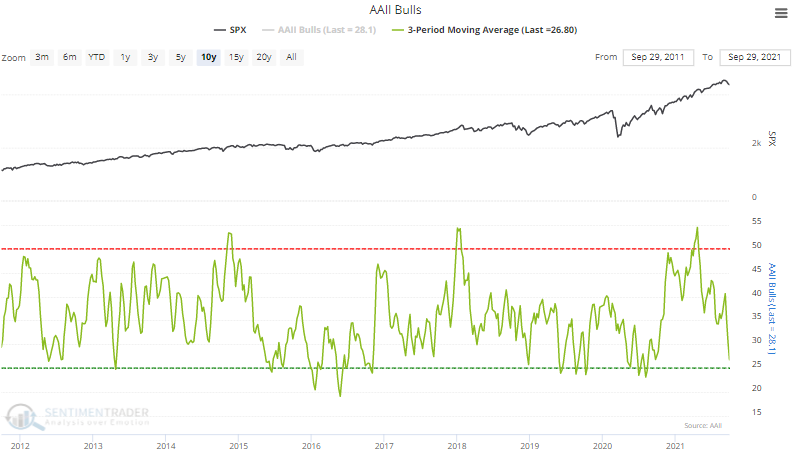
No bull. The percentage of bulls among individual investors in the AAII survey has averaged less than 27% over the past 3 weeks. That's among the lowest readings of the past decade.

aaii bulls

DATA &
TECHnologies
IndicatorEdge
‍
BackTestEdge
‍
Other Tools
‍
DataEdge API
RESEARCH
reports
Research Solution
‍
Reports Library
‍
actionable
Strategies
Trading Strategies
‍
Smart Stock Scanner
‍
FREE
RESOUrCES
Simple Backtest
Calculator
Simple Seasonality
Calculator
The Kelly Criterion
Calculator
Sentiment Geo Map
‍
Public Research Reports
‍
Free Webinar
COMPANY
‍
About
‍
Meet our Team
‍
In the News
‍
Testimonials
‍
Client Success Stories
Pricing
Bundle pricing
‍
Announcements
‍
FAQ
© 2024 Sundial Capital Research Inc. All rights reserved.
Setsail Marketing
TermsPrivacyAffiliate Program
Risk Disclosure: Futures and forex trading contains substantial risk and is not for every investor. An investor could potentially lose all or more than the initial investment. Risk capital is money that can be lost without jeopardizing ones’ financial security or life style. Only risk capital should be used for trading and only those with sufficient risk capital should consider trading. Past performance is not necessarily indicative of future results.

Hypothetical Performance Disclosure: Hypothetical performance results have many inherent limitations, some of which are described below. No representation is being made that any account will or is likely to achieve profits or losses similar to those shown; in fact, there are frequently sharp differences between hypothetical performance results and the actual results subsequently achieved by any particular trading program. One of the limitations of hypothetical performance results is that they are generally prepared with the benefit of hindsight. In addition, hypothetical trading does not involve financial risk, and no hypothetical trading record can completely account for the impact of financial risk of actual trading. for example, the ability to withstand losses or to adhere to a particular trading program in spite of trading losses are material points which can also adversely affect actual trading results. There are numerous other factors related to the markets in general or to the implementation of any specific trading program which cannot be fully accounted for in the preparation of hypothetical performance results and all which can adversely affect trading results.

Testimonial Disclosure: Testimonials appearing on this website may not be representative of other clients or customers and is not a guarantee of future performance or success.