Data &
Technology
Research
Reports
Report Solutions
Reports Library
Actionable
Strategies
Free
Resources
Simple Backtest Calculator
Simple Seasonality Calculator
The Kelly Criterion Calculator
Sentiment Geo Map
Public Research Reports
Free Webinar
Pricing
Company
About
Meet Our Team
In the News
Testimonials
Client Success Stories
Contact
Log inLoginSign up
< BACK TO ALL REPORTS

The last hour has been a bear

Jason Goepfert
2021-03-29
Over the past 3 months, stocks have consistently been selling off during the last hour of trading. That has pushed the Cumulative Last Hour indicator near a 52-week low while stocks hover near 52-week highs.

You wouldn't know it by the last couple of days, Friday in particular, but the past few months have been dominated by late-day selling pressure. This predates issues with the blowup of Archegos Capital, though Friday's late-day buying ramp could have been directly influenced.

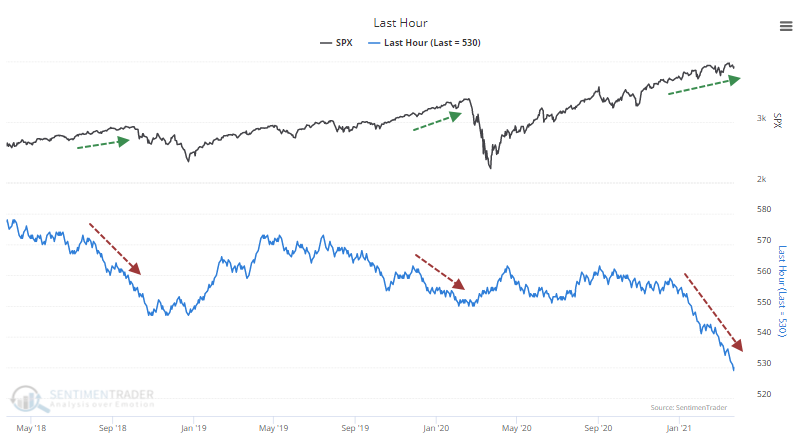
The Cumulative Last Hour indicator looks at the last hour of trading in the S&P 500 fund, SPY. If the fund rises during that hour, then the indicator adds 1 to the running total. If it drops, then it subtracts 1. Dean noted in February how this gave a signal that has preceded some weakness in the past.

Recent months have seen a continual erosion in the indicator, to the point where it's at the lowest level in 6 years. When stocks have been persistently hitting new highs while the Last Hour indicator was plumbing new lows, it has been a warning sign.

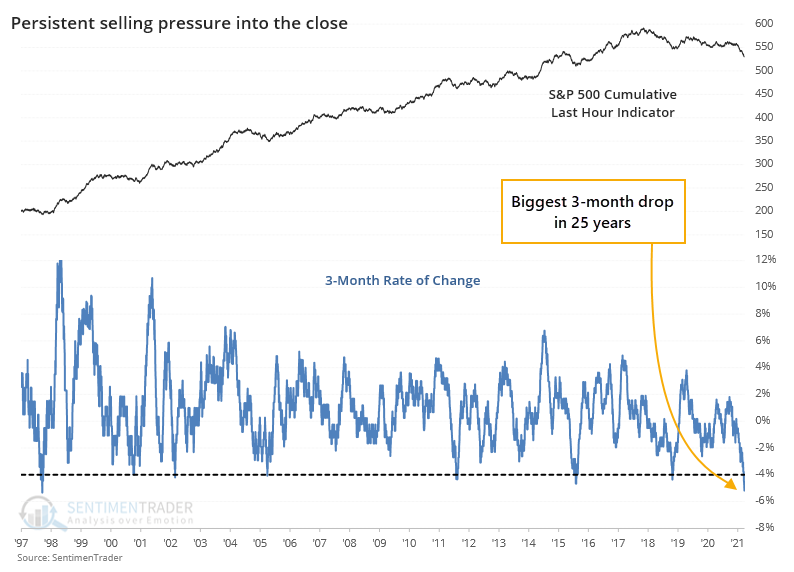
What is especially notable about the current behavior is just how persistent the selling has been during the last hour. Over the past 3 months, the indicator has dropped 5%, which doesn't sound like a lot, but it's the biggest plunge in 25 years.

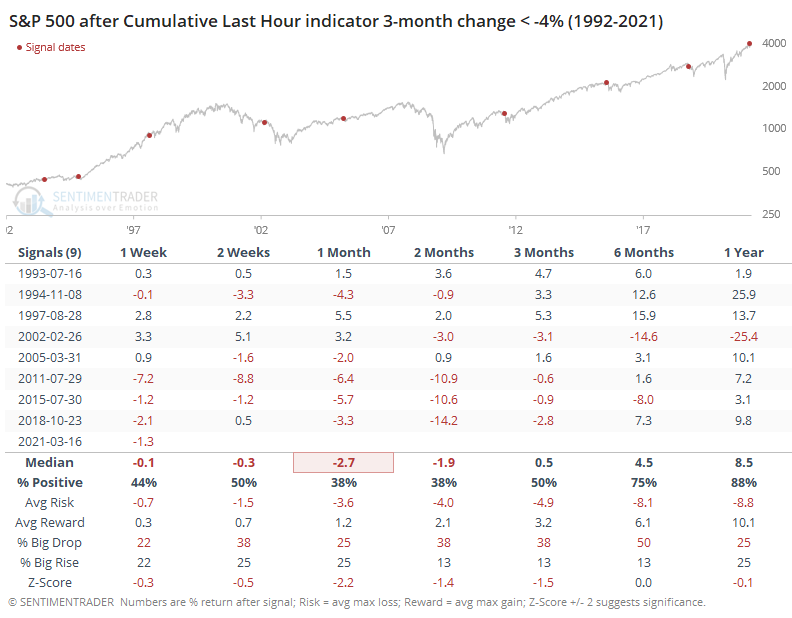
The table below shows that when the indicator dropped 4% or more over a 3-month period, stocks struggled. The only exceptions were in 1995 and 1997.

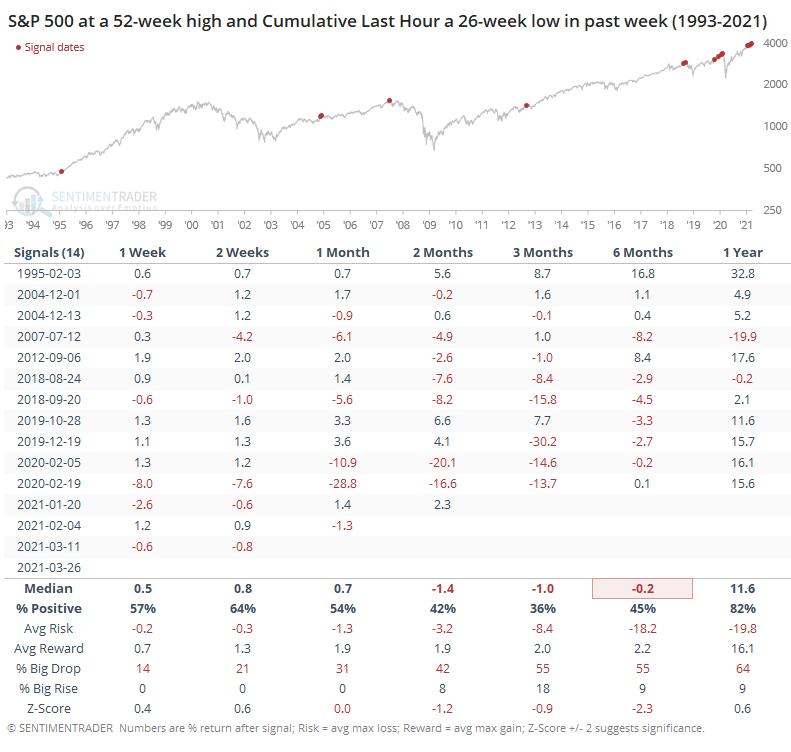
When we look specifically for divergences between the S&P and the Last Hour indicator, with them recently at opposite 52-week extremes, then there isn't much of a sample size. It never happened prior to 2012, and all of them witnessed some weakness going forward.

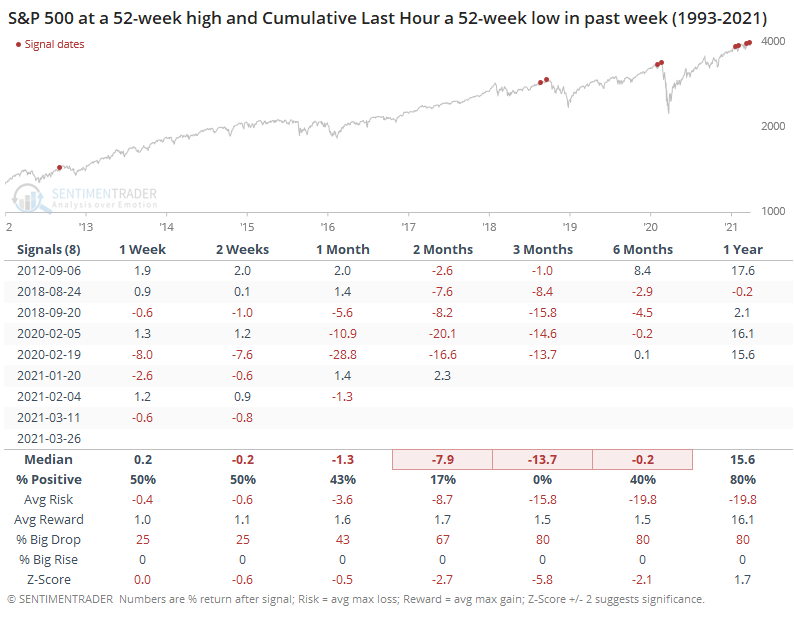
Looking at lesser extremes, when the S&P was at a new high and the Last Hour indicator was at a 6-month low, there were a few more precedents. The only one that saw uninterrupted upside was the first one, back in 1995.

The initial concept of looking at the last hour of trading originated decades ago with the theory that emotional traders make decisions at the open in a knee-jerk reaction to overnight news, while the smart money executed their transactions near the close of trading after absorbing and considering all the data and other traders' reactions.

It's an interesting theory, and probably a good one. It's become less compelling in recent years due to the passive investing trend and the massive amount of volume that funds transact in the last hour nowadays. Maybe that has rendered this indicator useless.

Until there's consistent evidence that that's the case, though, we'll continue to use it as an input, and currently, it is without a doubt signaling caution.

Sorry, you don't have access to this report

Upgrade your subscription plan to get access
Go to Dasboard
DATA &
TECHnologies
IndicatorEdge
‍
BackTestEdge
‍
Other Tools
‍
DataEdge API
RESEARCH
reports
Research Solution
‍
Reports Library
‍
actionable
Strategies
Trading Strategies
‍
Smart Stock Scanner
‍
FREE
RESOUrCES
Simple Backtest
Calculator
Simple Seasonality
Calculator
The Kelly Criterion
Calculator
Sentiment Geo Map
‍
Public Research Reports
‍
Free Webinar
COMPANY
‍
About
‍
Meet our Team
‍
In the News
‍
Testimonials
‍
Client Success Stories
Pricing
Bundle pricing
‍
Announcements
‍
FAQ
© 2024 Sundial Capital Research Inc. All rights reserved.
Setsail Marketing
TermsPrivacyAffiliate Program
Risk Disclosure: Futures and forex trading contains substantial risk and is not for every investor. An investor could potentially lose all or more than the initial investment. Risk capital is money that can be lost without jeopardizing ones’ financial security or life style. Only risk capital should be used for trading and only those with sufficient risk capital should consider trading. Past performance is not necessarily indicative of future results.

Hypothetical Performance Disclosure: Hypothetical performance results have many inherent limitations, some of which are described below. No representation is being made that any account will or is likely to achieve profits or losses similar to those shown; in fact, there are frequently sharp differences between hypothetical performance results and the actual results subsequently achieved by any particular trading program. One of the limitations of hypothetical performance results is that they are generally prepared with the benefit of hindsight. In addition, hypothetical trading does not involve financial risk, and no hypothetical trading record can completely account for the impact of financial risk of actual trading. for example, the ability to withstand losses or to adhere to a particular trading program in spite of trading losses are material points which can also adversely affect actual trading results. There are numerous other factors related to the markets in general or to the implementation of any specific trading program which cannot be fully accounted for in the preparation of hypothetical performance results and all which can adversely affect trading results.

Testimonial Disclosure: Testimonials appearing on this website may not be representative of other clients or customers and is not a guarantee of future performance or success.