Data &
Technology
Research
Reports
Report Solutions
Reports Library
Actionable
Strategies
Free
Resources
Simple Backtest Calculator
Simple Seasonality Calculator
The Kelly Criterion Calculator
Sentiment Geo Map
Public Research Reports
Free Webinar
Pricing
Company
About
Meet Our Team
In the News
Testimonials
Client Success Stories
Contact
Log inLoginSign up
< BACK TO ALL REPORTS

The last 100 days have been just like...

Jason Goepfert
2020-08-18
The last 100 days have seen a massive, protracted rally in stocks. While it is like the post-2009 recovery, there are higher-correlated periods.

Price comparisons are becoming popular again as we've reached the 100-day mark of the rally. More and more analogs are being drawn to 2009 and other major lows - rightly so, in many respects - because the rally has been so persistent, and so large.

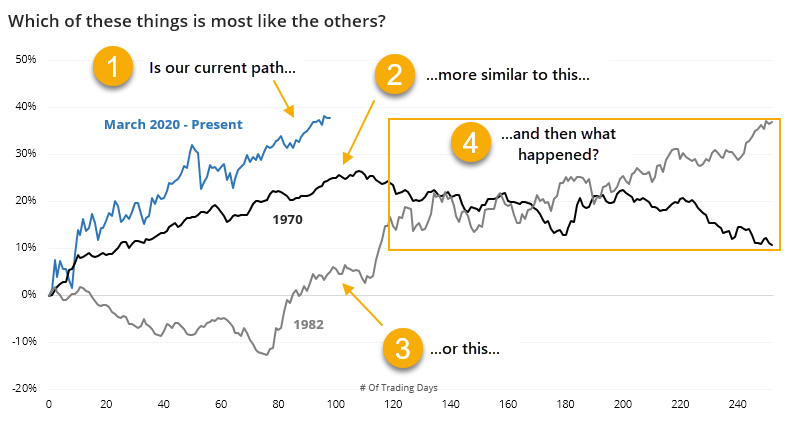
An analog, or comparing one period of time to another, tries to answer some simple questions - are the past x number of days more similar to some historical stretches versus others? And if so, what happened after the most similar ones?

S&P 500 100 day price analog

The trouble with analogs is that they can be easily abused. We can find whatever we want to find.

As a guard against that, when we show analogs, we only do so objectively, with clear rules and with all available history. Most of the time, they're useless and don't support whatever cherry-picked example is popular at the moment. Rarely, they can help support other factors, but even then they're a tertiary guide.

If we look objectively at the past 100 sessions and go back to 1928 to look for other 100-day periods with the highest correlations (all of which were above +0.95 on a scale from -1.0 to +1.0), then we see that the last 100 days weren't the most highly correlated to the rally off the 2009 low. Or 1982. The 100 days with the highest correlation ended in April 1971.


This is an abridged version of our recent reports and notes. For immediate access with no obligation, sign up for a 30-day free trial now.

We also looked at:

  • A full look at the highest-correlated 100-day periods since 1928
  • And the most highly-correlated 252-day periods, some of which were quite different
  • The average S&P 500 sector is within an inch of new all-time highs
  • So is the S&P itself...what it means after recovering from a bear market
DATA &
TECHnologies
IndicatorEdge
‍
BackTestEdge
‍
Other Tools
‍
DataEdge API
RESEARCH
reports
Research Solution
‍
Reports Library
‍
actionable
Strategies
Trading Strategies
‍
Smart Stock Scanner
‍
FREE
RESOUrCES
Simple Backtest
Calculator
Simple Seasonality
Calculator
The Kelly Criterion
Calculator
Sentiment Geo Map
‍
Public Research Reports
‍
Free Webinar
COMPANY
‍
About
‍
Meet our Team
‍
In the News
‍
Testimonials
‍
Client Success Stories
Pricing
Bundle pricing
‍
Announcements
‍
FAQ
© 2024 Sundial Capital Research Inc. All rights reserved.
Setsail Marketing
TermsPrivacyAffiliate Program
Risk Disclosure: Futures and forex trading contains substantial risk and is not for every investor. An investor could potentially lose all or more than the initial investment. Risk capital is money that can be lost without jeopardizing ones’ financial security or life style. Only risk capital should be used for trading and only those with sufficient risk capital should consider trading. Past performance is not necessarily indicative of future results.

Hypothetical Performance Disclosure: Hypothetical performance results have many inherent limitations, some of which are described below. No representation is being made that any account will or is likely to achieve profits or losses similar to those shown; in fact, there are frequently sharp differences between hypothetical performance results and the actual results subsequently achieved by any particular trading program. One of the limitations of hypothetical performance results is that they are generally prepared with the benefit of hindsight. In addition, hypothetical trading does not involve financial risk, and no hypothetical trading record can completely account for the impact of financial risk of actual trading. for example, the ability to withstand losses or to adhere to a particular trading program in spite of trading losses are material points which can also adversely affect actual trading results. There are numerous other factors related to the markets in general or to the implementation of any specific trading program which cannot be fully accounted for in the preparation of hypothetical performance results and all which can adversely affect trading results.

Testimonial Disclosure: Testimonials appearing on this website may not be representative of other clients or customers and is not a guarantee of future performance or success.