Data &
Technology
Research
Reports
Report Solutions
Reports Library
Actionable
Strategies
Free
Resources
Simple Backtest Calculator
Simple Seasonality Calculator
The Kelly Criterion Calculator
Sentiment Geo Map
Public Research Reports
Free Webinar
Pricing
Company
About
Meet Our Team
In the News
Testimonials
Client Success Stories
Contact
Log inLoginSign up
< BACK TO ALL REPORTS

The Investors Intelligence bull-bear spread reverses higher

Dean Christians
2023-06-15
When the Investors Intelligence Bull-Bear spread shifts from less than 0% to greater than 30%, the S&P 500 typically experiences a temporary period of consolidation to digest the recent gains. Investors should use that opportunity to buy stocks as the S&P 500 is higher 95% of the time a year later.

Key points:

  • The Investors Intelligence Bull-Bear spread cycled from less than 0% to greater than 30%
  • Initially, the shift in sentiment caused a brief setback, but it eventually resulted in excellent results
  • Offensive sectors tend to outperform defensive ones when sentiment reverses, like now

Newsletter writers are turning more bullish 

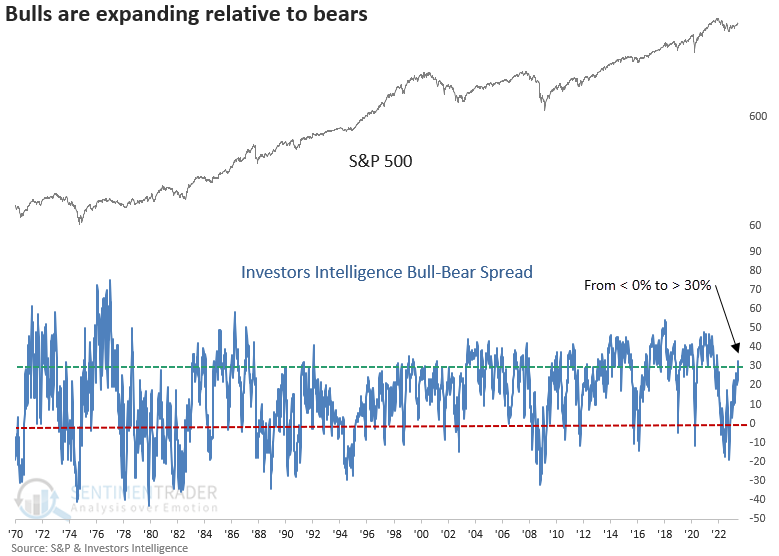
The reversal from pessimism to optimism in sentiment indicators continues as investors embrace the bullish price action in stocks.

The oldest stock market survey, Investors Intelligence, which measures newsletter writers, showed an increase in bulls relative to bears with the latest update on Wednesday.

The spread between survey members who are either bullish or bearish has now cycled from less than 0% to greater than 30% for only the 21st time since 1971.

Similar shifts in sentiment led to outstanding long-term results for stocks

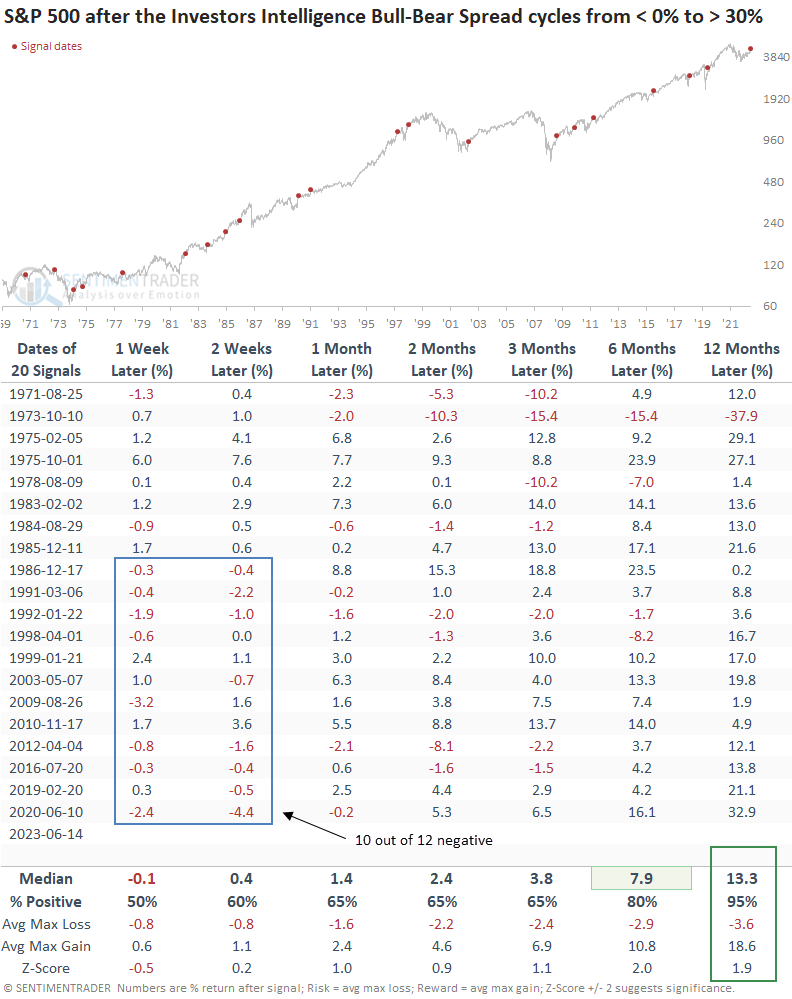
When the Investor's Intelligence bull-bear spread shifts from less than 0% to greater than 30%, the S&P 500 struggles during the first few weeks. Over the past three decades, 10 out of 12 precedents have exhibited losses at some point within that time frame. However, the index was higher a year later in all but one case.

Signal dates reflect the as-of-report date.

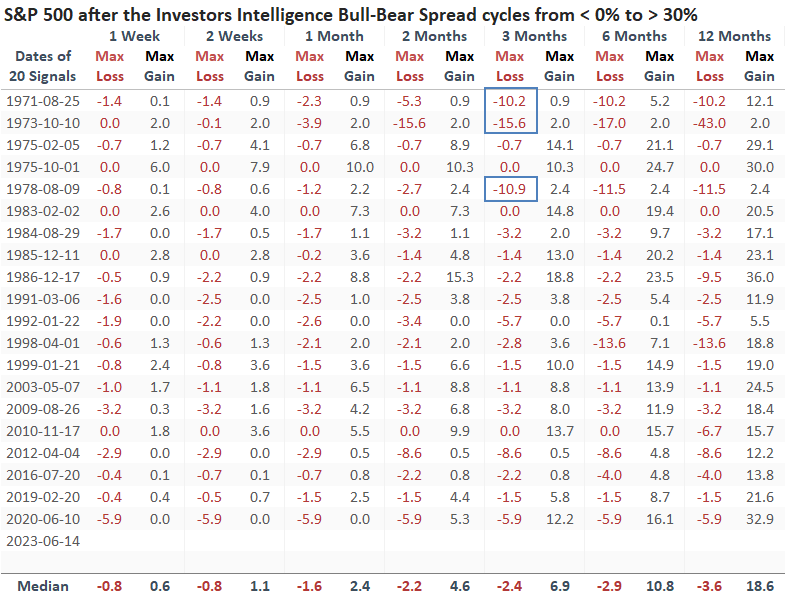
During the inflationary 1970s, there was a higher prevalence of medium-term max losses surpassing -10%. Such occurrences have been absent for over 40 years.

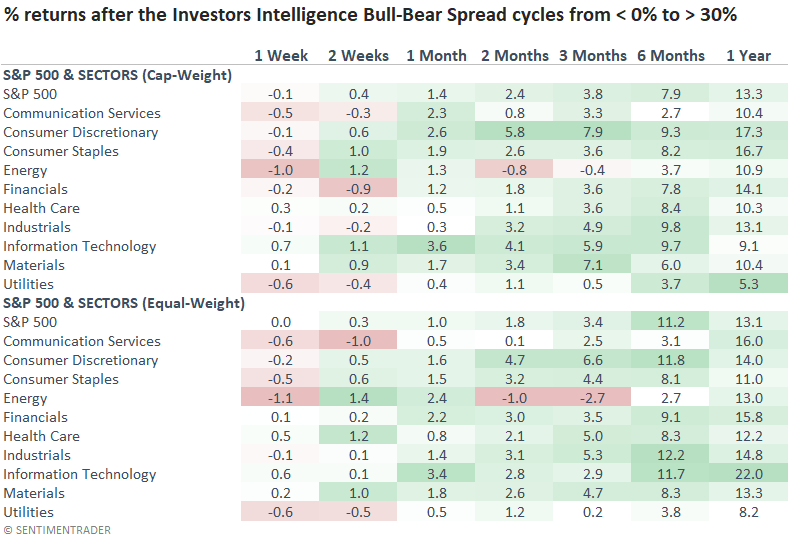
Given that most signals occurred as the stock market transitioned from a period of risk-off to risk-on, it's not surprising to see offensive sectors perform better.

What the research tells us...

A significant shift is underway in investor behavior as the herd moves from a pessimistic outlook to an increasingly optimistic one. Rising stock prices will do that. The Investors Intelligence bull-bear spread is the latest indicator to confirm this renewed optimism. When the spread cycles from below 0% to above 30%, the S&P 500 tends to experience a temporary pause lasting a few weeks. However, I would buy the consolidation/correction as large-cap stocks are higher a year later in all but one case.

Sorry, you don't have access to this report

Upgrade your subscription plan to get access
Go to Dasboard
DATA &
TECHnologies
IndicatorEdge
‍
BackTestEdge
‍
Other Tools
‍
DataEdge API
RESEARCH
reports
Research Solution
‍
Reports Library
‍
actionable
Strategies
Trading Strategies
‍
Smart Stock Scanner
‍
FREE
RESOUrCES
Simple Backtest
Calculator
Simple Seasonality
Calculator
The Kelly Criterion
Calculator
Sentiment Geo Map
‍
Public Research Reports
‍
Free Webinar
COMPANY
‍
About
‍
Meet our Team
‍
In the News
‍
Testimonials
‍
Client Success Stories
Pricing
Bundle pricing
‍
Announcements
‍
FAQ
© 2024 Sundial Capital Research Inc. All rights reserved.
Setsail Marketing
TermsPrivacyAffiliate Program
Risk Disclosure: Futures and forex trading contains substantial risk and is not for every investor. An investor could potentially lose all or more than the initial investment. Risk capital is money that can be lost without jeopardizing ones’ financial security or life style. Only risk capital should be used for trading and only those with sufficient risk capital should consider trading. Past performance is not necessarily indicative of future results.

Hypothetical Performance Disclosure: Hypothetical performance results have many inherent limitations, some of which are described below. No representation is being made that any account will or is likely to achieve profits or losses similar to those shown; in fact, there are frequently sharp differences between hypothetical performance results and the actual results subsequently achieved by any particular trading program. One of the limitations of hypothetical performance results is that they are generally prepared with the benefit of hindsight. In addition, hypothetical trading does not involve financial risk, and no hypothetical trading record can completely account for the impact of financial risk of actual trading. for example, the ability to withstand losses or to adhere to a particular trading program in spite of trading losses are material points which can also adversely affect actual trading results. There are numerous other factors related to the markets in general or to the implementation of any specific trading program which cannot be fully accounted for in the preparation of hypothetical performance results and all which can adversely affect trading results.

Testimonial Disclosure: Testimonials appearing on this website may not be representative of other clients or customers and is not a guarantee of future performance or success.