
The Inflation 4% Solution Updated

Key Points
- Because inflation (or deflation) impacts the cost of virtually everything, it can have a profound impact on the economy and - by extension - stocks
- Conventional wisdom claims that stocks are an effective "hedge" against inflation
- The reality is that while stocks have outpaced inflation over the long run, they are not necessarily a hedge against any specific bout of inflation
- It is possible to objectively deem inflation as "favorable" or "unfavorable" for stocks
How to measure inflation
The standard measure of inflation is the 12-month change in the Consumer Price Index (CPI). The Consumer Price Index (CPI) is:
- a measure that examines the weighted average of prices of a basket of consumer goods and services, such as transportation, food, and medical care
- used to assess price changes associated with the cost of living
- one of the most frequently used statistics for identifying periods of inflation or deflation
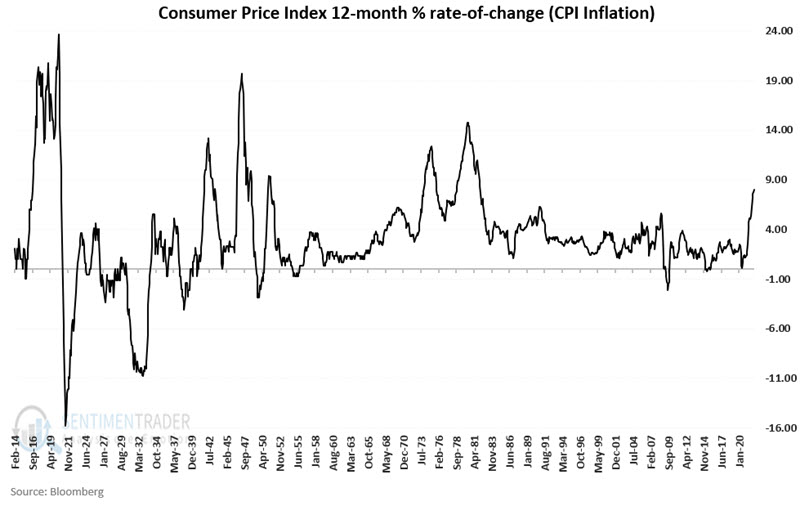
The calculation I use is to divide the latest raw Consumer Price Index value by the value for this index twelve months prior to arrive at a 12-month % rate-of-change. The chart below displays the historical results of this monthly calculation since 1914.
When to measure inflation
The CPI number for the previous month is typically reported early to mid-month. However, for testing purposes, at the end of each month, we will look at the latest reported 12-month rate of change in the Consumer Price Index.
How to evaluate inflation
Like Goldilocks, we want our inflation to be neither hot nor cold in generic terms. A moderate amount of inflation is normal and can even be somewhat beneficial. On the other hand:
- Soaring inflation throws cost estimates out the window and can cause massive economic disruption - something the market rarely takes kindly to
- Likewise, deflation - i.e., a trend of falling prices - can cause a downward economic spiral that is ugly for everyone
The question then is, "what is the right rate of inflation?" There is, of course, no such thing, partly because there are many other factors that affect the stock market beyond just inflation. Still, as far as deeming inflation "too high, too low or just right," we will use a straightforward method that can be referred to as "The 4% Inflation Solution."
The 4% Inflation Solution
Let's look at how the stock market has performed when inflation is:
- greater than or equal to +4% (significant inflation, i.e., "too hot")
- less than or equal to -4% (significant deflation, i.e., "too cold")
- greater than -4% but less than +4% ("just right")
For our test, we will use monthly data from February 1914 through February 2022 for the 12-month rate-of-change in the Consumer Price Index and the monthly closing price for the Dow Jones Industrial Average.
As a baseline, note that since 1914:
- The average 12-month % change for CPI is +3.23%, and the median % change is +2.61%
- The Dow Jones Industrial Average has gained +58,200%
Dow Performance when inflation >= +4%
The chart below displays the cumulative price performance for the Dow ONLY during those times when inflation was >= +4%.
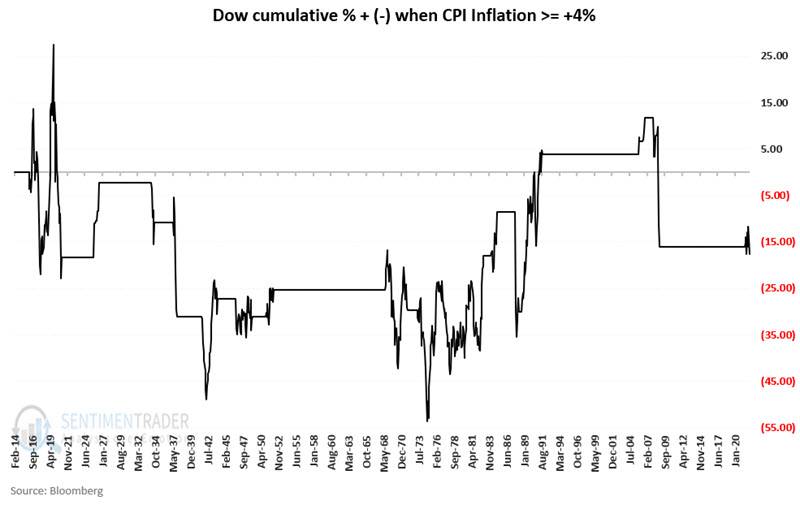
The result is a net price decline of -14.6%. In other words, despite the Dow gaining over 58,000% during the test period, an investor who held the Dow ONLY when inflation >= +4 would have lost money.
These results call the "stocks as a hedge against inflation" argument into question. On a buy-and-hold basis, yes, stocks have outperformed inflation over the long-term. But as you see in the chart above, during actual bouts of severe inflation, the stock market has been very much a mixed bag - with highly volatile and net negative returns.
Dow performance when inflation <= -4%
The chart below displays the cumulative price performance for the Dow during those times when inflation was <= -4%, i.e., during periods of severe deflation.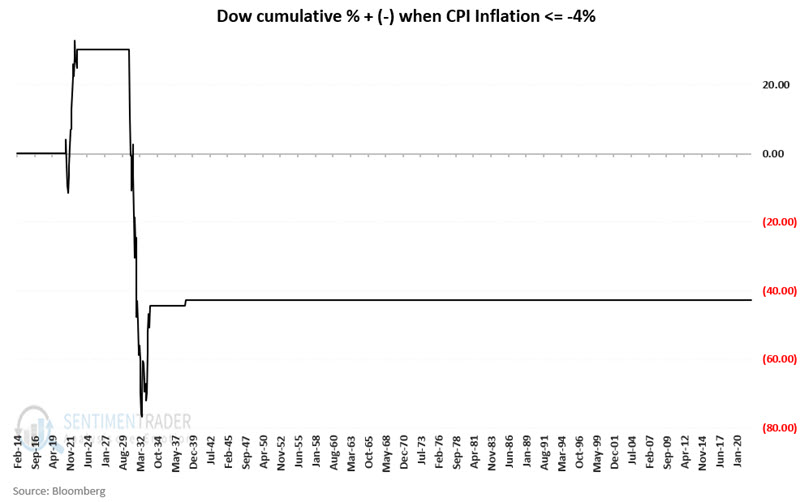
The result is a net price decline of -42.7%. As you can see, the results were disastrous, albeit limited to two periods - one in the early 1920s and another in the early 1930s. Would the stock market react the same way if we plunged again into a deflationary spiral? Here's hoping we never find out as severe deflation can cause a downward economic spiral. As prices decline, buying demand decreases as buyers wait for lower prices. This reduced demand creates something of a self-fulfilling prophecy as reduced demand results in reduced production which slows economic growth even more, and so on and so forth.
Dow performance when inflation < +4% and > -4%
The chart below displays cumulative Dow price performance when inflation is "Not too hot, not too cold" - i.e., between -4% and +4%.
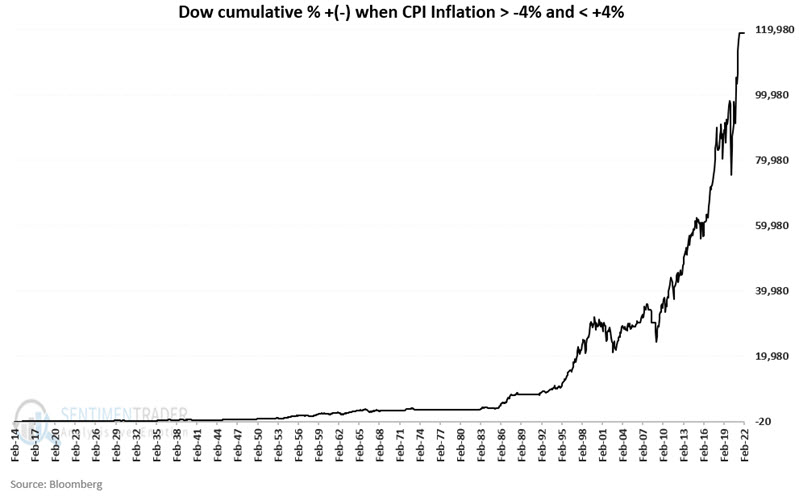
The result is a net price gain of +118,898%
As you can see in the chart above, just because inflation is moderate does not mean you cannot have bear markets. Inflation is only one factor that can impact the stock market. But clearly, the market appears to perform much better overall when inflation is under control.
Comparative results
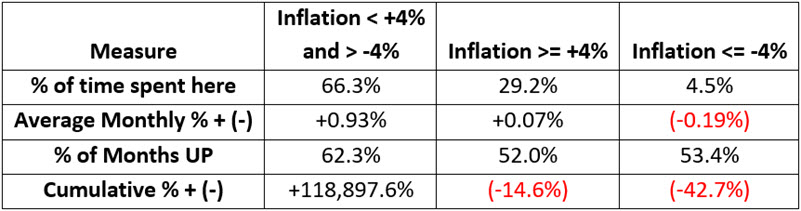
The table below puts a few facts and figures to the performance of the Dow during the different periods displayed in the charts above.
Putting the Inflation 4% Solution into action
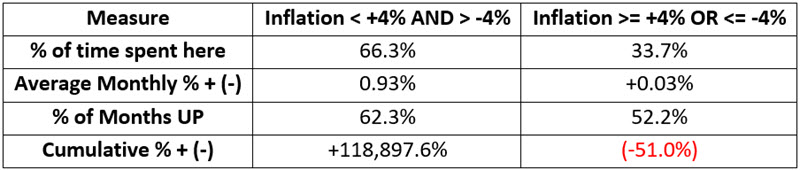
To tie everything together, we will designate the stock market environment as "Favorable" or "Unfavorable" as follows:
- Favorable = If inflation is below +4% AND above -4%
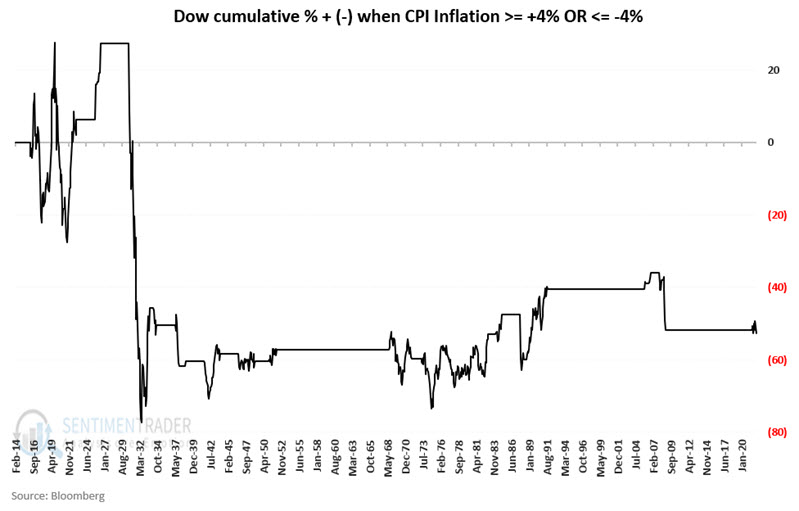
- Unfavorable = If inflation is +4% or higher OR above -4% or lower
The chart below displays the cumulative price performance for the Dow when the inflation environment is deemed "Unfavorable."
The table below compares Dow Jones Industrial Average price performance during Favorable versus Unfavorable periods.
What the research tells us…
The good news is that stocks have outpaced inflation over the past 100+ years. But the bad news is that when inflation has been abnormally high or low, stock market performance has been negative.
The key takeaways: 1) The argument that stocks are "a hedge against inflation" really only applies to buy-and-hold investors who are willing to ride every bear market to the bottom and back. 2) Abnormal inflation does not guarantee that stocks will perform poorly. But long-term performance results for the Dow Jones Industrial Average during high and low inflation periods suggest that abnormal inflation must be viewed as a negative for the stock market.