Data &
Technology
Research
Reports
Report Solutions
Reports Library
Actionable
Strategies
Free
Resources
Simple Backtest Calculator
Simple Seasonality Calculator
The Kelly Criterion Calculator
Sentiment Geo Map
Public Research Reports
Free Webinar
Pricing
Company
About
Meet Our Team
In the News
Testimonials
Client Success Stories
Contact
Log inLoginSign up
< BACK TO ALL REPORTS

The improbability of a 3-peat

Jason Goepfert
2020-12-30
The technology sector is on track for its 2nd straight year of leading all sectors, with massive gains both years.

In September, we saw that energy was not only the most-hated sector in 2020, it was the most-hated of any sector of all time.

The flip side is that when there's a sector that does very poorly, there's usually a different one that does very well. This year, of course, that's the technology sector. It was the best sector last year, too.

Below, we can see each sector's yearly returns since 2000. The top sector for that year is highlighted in green; the worst in red. The numbers aren't that important, with the biggest takeaway being just how random the colors seem to be. There isn't a lot of continuity - the best sector one year usually isn't the best the next year. It's a little more common for the worst sector to repeat, but even that is fairly rare.

Best and worst sectors

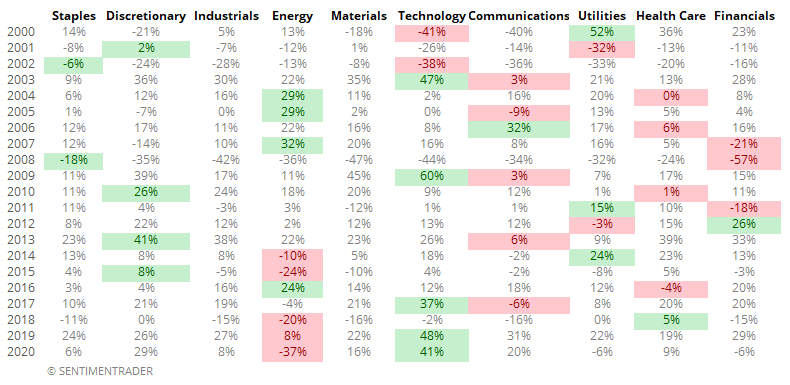
In the table, we can see that energy has been the worst sector for 3 years in a row, while tech has been the best on back-to-back years, and with massive gains.

When we go back to 1926 and look for similar years when a sector so dominated its peers, we see just how rare it is, with only 3 sectors managing to accomplish such a feat.


What else is happening

These are topics we explored in our most recent research. For immediate access with no obligation, sign up for a 30-day free trial now.

  • Full details on which sectors have performed best on consecutive years
  • What happened to those sectors when the gains were moderate, large, or massive
  • Next-year returns when a sector gains 40% on consecutive years
  • Despite indexes being at/near new highs, daily breadth is very weak
  • The small-cap Russell 2000 is seeing a big loss vs other indexes
  • Internal momentum is curiously lagging

Stat Box

Tuesday was the 23rd time since 1962 when the S&P 500 closed within 0.25% of a 52-week high and yet fewer than 40% of issues on the NYSE managed to advance, and less than 40% of volume flowed into those securities. Over the next month, 8 of those days saw the S&P close higher a month later.

Sentiment from other perspectives

We don't necessarily agree with everything posted here - some of our work might directly contradict it - but it's often worth knowing what others are watching.

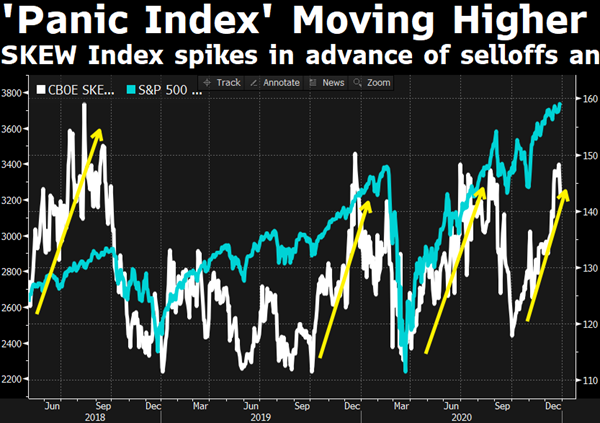
1. At least someone seems to be hedging. The SKEW Index shows traders are paying up for put options, increasing the probability of a large move in the next 30 days. [Bloomberg TV]

cboe skew

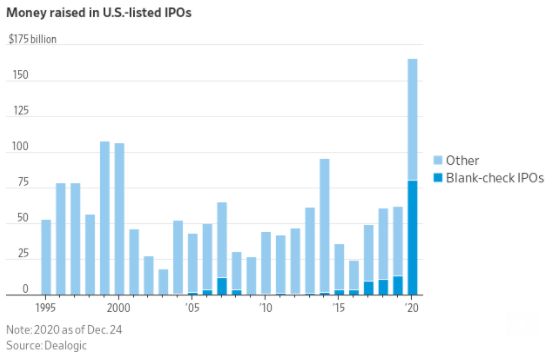
2. Just because this will never get old - the rise in IPOs in 2020 is shattering almost all records. Proceeds raised by bankers to a willing public are up more than 50% from the prior peak. [Wall Street Journal]

ipo proceeds

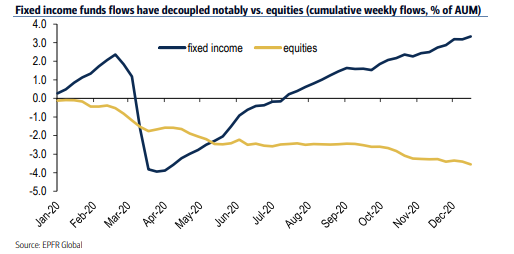
3. Curiously, funds continue to see outflows (in stocks) as investors gravitate more and more toward individual equities. [EPFR]

fund flows

DATA &
TECHnologies
IndicatorEdge
‍
BackTestEdge
‍
Other Tools
‍
DataEdge API
RESEARCH
reports
Research Solution
‍
Reports Library
‍
actionable
Strategies
Trading Strategies
‍
Smart Stock Scanner
‍
FREE
RESOUrCES
Simple Backtest
Calculator
Simple Seasonality
Calculator
The Kelly Criterion
Calculator
Sentiment Geo Map
‍
Public Research Reports
‍
Free Webinar
COMPANY
‍
About
‍
Meet our Team
‍
In the News
‍
Testimonials
‍
Client Success Stories
Pricing
Bundle pricing
‍
Announcements
‍
FAQ
© 2024 Sundial Capital Research Inc. All rights reserved.
Setsail Marketing
TermsPrivacyAffiliate Program
Risk Disclosure: Futures and forex trading contains substantial risk and is not for every investor. An investor could potentially lose all or more than the initial investment. Risk capital is money that can be lost without jeopardizing ones’ financial security or life style. Only risk capital should be used for trading and only those with sufficient risk capital should consider trading. Past performance is not necessarily indicative of future results.

Hypothetical Performance Disclosure: Hypothetical performance results have many inherent limitations, some of which are described below. No representation is being made that any account will or is likely to achieve profits or losses similar to those shown; in fact, there are frequently sharp differences between hypothetical performance results and the actual results subsequently achieved by any particular trading program. One of the limitations of hypothetical performance results is that they are generally prepared with the benefit of hindsight. In addition, hypothetical trading does not involve financial risk, and no hypothetical trading record can completely account for the impact of financial risk of actual trading. for example, the ability to withstand losses or to adhere to a particular trading program in spite of trading losses are material points which can also adversely affect actual trading results. There are numerous other factors related to the markets in general or to the implementation of any specific trading program which cannot be fully accounted for in the preparation of hypothetical performance results and all which can adversely affect trading results.

Testimonial Disclosure: Testimonials appearing on this website may not be representative of other clients or customers and is not a guarantee of future performance or success.