Data &
Technology
Research
Reports
Report Solutions
Reports Library
Actionable
Strategies
Free
Resources
Simple Backtest Calculator
Simple Seasonality Calculator
The Kelly Criterion Calculator
Sentiment Geo Map
Public Research Reports
Free Webinar
Pricing
Company
About
Meet Our Team
In the News
Testimonials
Client Success Stories
Contact
Log inLoginSign up
< BACK TO ALL REPORTS

The ice is cracking

Jason Goepfert
2021-01-26
As the S&P 500 moves to new highs, fewer stocks are trading above their short-term moving averages, and the McClellan Oscillator has been hanging below the zero line.

Since markets bottomed last fall, both Dean and I have highlighted the impressive participation and thrusts underlying the rise in the indexes. A lot of stocks (and bonds) were rising, and the buying pressure was impressive. That kind of activity tends to lead to longer-term gains.

Shorter-term is a different matter, but even that has led to only inconsistent losses. The biggest issues have come when underlying momentum wanes and we see cracks under the surface.

That's what's happening now.

In multiple Daily Reports over the last couple of weeks, we've pointed out oddities on days the indexes rallied. That's a change from recent months, and by themselves, they're not a big warning sign. When it starts to spread, and we see clusters, then it's more of a worry.

As noted yesterday, the S&P 500 closed at another record high on Monday, and yet fewer than 45% of its stocks managed to close above their 10-day moving averages. That's a lot of short-term downtrends on a day the index closed at a high.

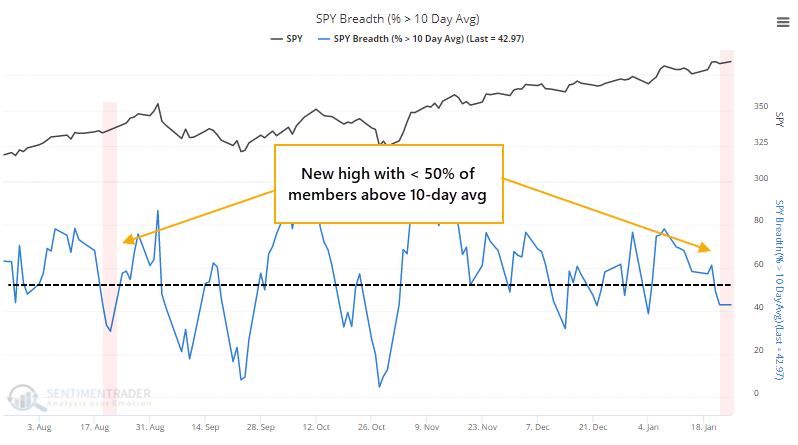
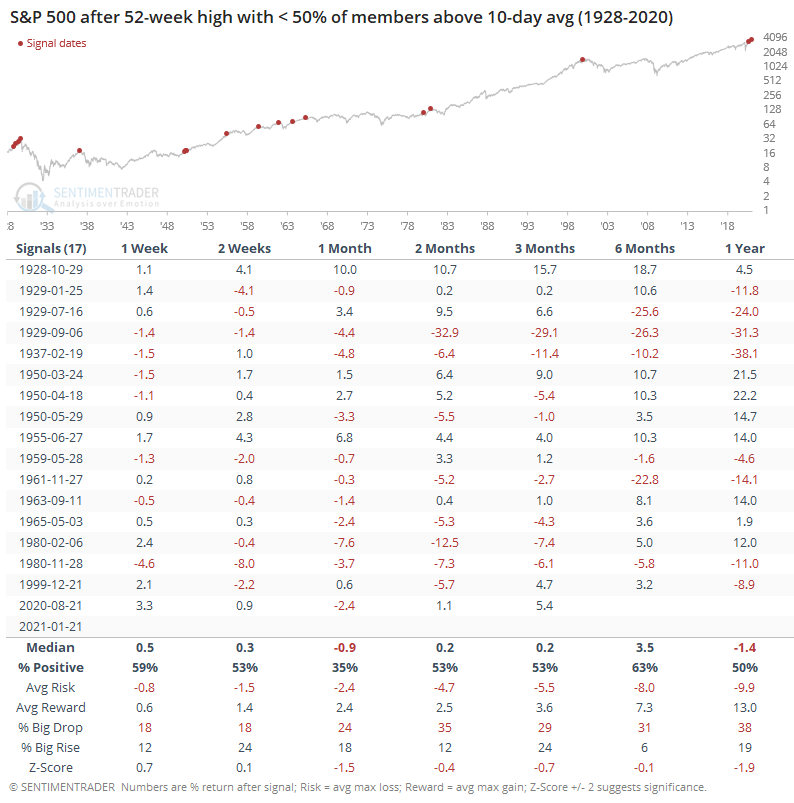
The only time in recent years that we've pointed out similar behavior was last August. The indexes managed to run for a couple more weeks, then suffered corrections in September. If we relax that to 50%, then it's still unusual, and forward returns were not impressive.

The reason why relatively few stocks are above their 10-day averages is that relatively few have been rising on days the S&P showed a gain. That difference between advancing and declining stocks has been negative enough that the McClellan Oscillator for the S&P 500 is well below zero.

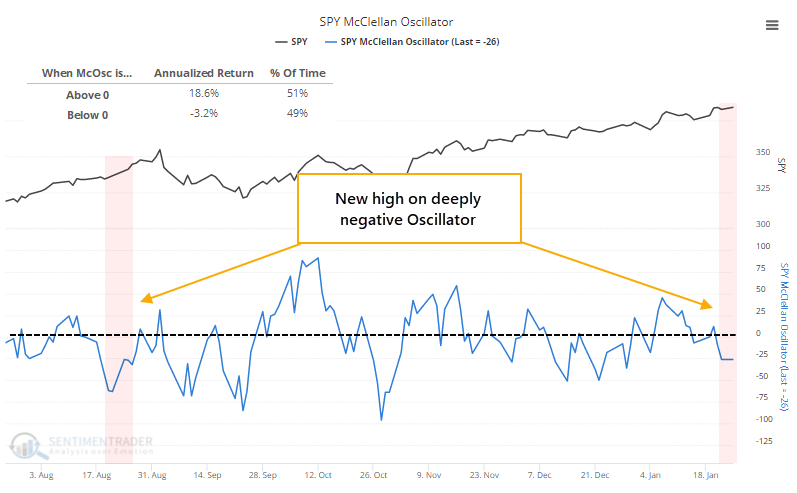
We can see from the chart that the S&P's annualized return since 1928 when its Oscillator was below zero is an abysmal -3.2%.

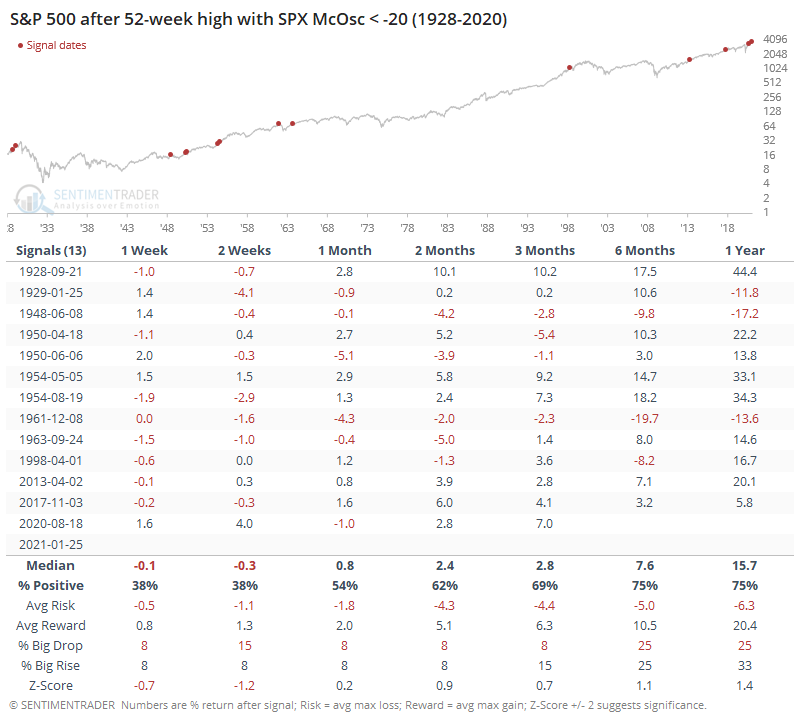
Once again, it's unusual to see it below zero, and especially well below zero, when the index itself closes at a 52-week high. The only time in recent years that it triggered was last August.

Markets are currently being held in captivity by another wave of speculation among options traders. The only time in 20 years that speculation neared the current level was in the latter half of last August. It's probably not a coincidence that that was also when we started to see initial signs of deterioration in stocks underlying the major indexes like we are now.

Growing up in the frigid Upper Midwest, we quickly learn to identify "bad" ice versus "good" ice. Mistaking one for the other leads to a very unpleasant outcome. Until the last week or so, markets have been skating on good ice. Recent sessions have started to pop off that cracking sound that makes the hairs stand up on the back of the neck of anyone walking across a frozen lake. Sometimes it's just new ice forming. Most of the time, it's the precursor to a fall.

DATA &
TECHnologies
IndicatorEdge
‍
BackTestEdge
‍
Other Tools
‍
DataEdge API
RESEARCH
reports
Research Solution
‍
Reports Library
‍
actionable
Strategies
Trading Strategies
‍
Smart Stock Scanner
‍
FREE
RESOUrCES
Simple Backtest
Calculator
Simple Seasonality
Calculator
The Kelly Criterion
Calculator
Sentiment Geo Map
‍
Public Research Reports
‍
Free Webinar
COMPANY
‍
About
‍
Meet our Team
‍
In the News
‍
Testimonials
‍
Client Success Stories
Pricing
Bundle pricing
‍
Announcements
‍
FAQ
© 2024 Sundial Capital Research Inc. All rights reserved.
Setsail Marketing
TermsPrivacyAffiliate Program
Risk Disclosure: Futures and forex trading contains substantial risk and is not for every investor. An investor could potentially lose all or more than the initial investment. Risk capital is money that can be lost without jeopardizing ones’ financial security or life style. Only risk capital should be used for trading and only those with sufficient risk capital should consider trading. Past performance is not necessarily indicative of future results.

Hypothetical Performance Disclosure: Hypothetical performance results have many inherent limitations, some of which are described below. No representation is being made that any account will or is likely to achieve profits or losses similar to those shown; in fact, there are frequently sharp differences between hypothetical performance results and the actual results subsequently achieved by any particular trading program. One of the limitations of hypothetical performance results is that they are generally prepared with the benefit of hindsight. In addition, hypothetical trading does not involve financial risk, and no hypothetical trading record can completely account for the impact of financial risk of actual trading. for example, the ability to withstand losses or to adhere to a particular trading program in spite of trading losses are material points which can also adversely affect actual trading results. There are numerous other factors related to the markets in general or to the implementation of any specific trading program which cannot be fully accounted for in the preparation of hypothetical performance results and all which can adversely affect trading results.

Testimonial Disclosure: Testimonials appearing on this website may not be representative of other clients or customers and is not a guarantee of future performance or success.