Products
SentimenTrader Trading Tools
‍
Backtest Engine
My Trading Toolkit
Correlation Analysis
Seasonality
Market Prediction
Indicators & Data API
‍
Proprietary Indicators & Charts
Market Data API
Strategies & Scanner
‍
50+ Trading Strategies
Smart Stock Scanner
Smart Option Scanner
Research Reports
‍
Research Solutions
Reports Library
Free Resources
Simple Backtest Calculator
Simple Seasonality Calculator
The Kelly Criterion Calculator
Sentiment Geo Map
Public Research Reports
Education
Sentiment Indicators
Technical Indicators
Pricing
Company
About
In the News
Testimonials
Client Success Stories
Contact
Log inLoginSign up
< BACK TO ALL REPORTS

The highflying Nasdaq 100 stocks have become the "safe" ones

Jason Goepfert
2020-07-23
Even as the big tech stocks drive the Nasdaq 100 to new highs with big moves, that index has oddly become "safer" relative to the broader market.

On the Nasdaq's march to new highs, a curious thing has happened - they've become the "safe" stocks.

As the Wall Street Journal noted, starting during the pandemic, many stocks that would be considered highflying flipped their usual patterns. As indexes like the S&P 500 rose and fell, these stocks rose or fell less than the S&P or even moved in the opposite direction.

Over the past 20 sessions, its beta has plunged to 0.74 relative to the S&P 500, its lowest in more than 100 days.

Nasdaq 100 NDX beta to S&P 500

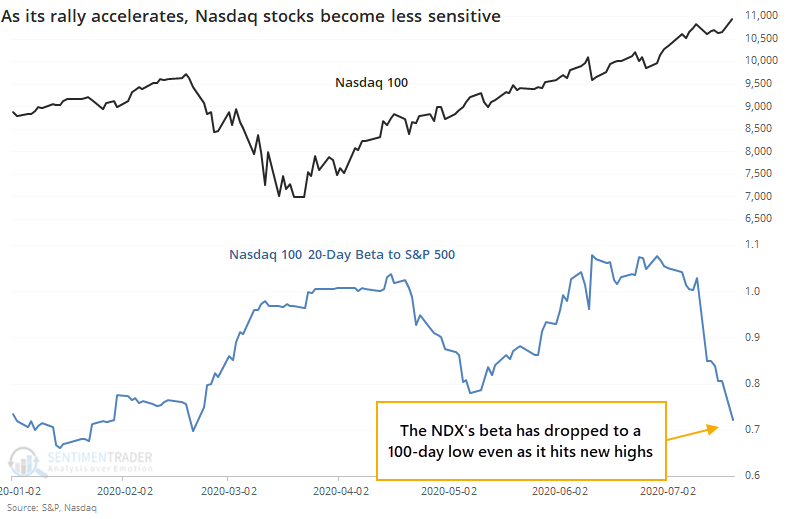
This has been a modest negative for the Nasdaq 100 going forward, with below-average returns and a poor risk/reward ratio, especially up to three months later.

Over the next 1-3 months, the ratio consistently dropped as the S&P outperformed the NDX. There have been other signs in recent weeks that incessant outperformance of these stocks might start to falter, and this is another (minor) one.


This is an abridged version of our recent reports and notes. For immediate access with no obligation, sign up for a 30-day free trial now.

We also looked at:

  • A more in-depth look at what happens in the Nasdaq 100 and S&P 500 when its beta falls even as it hits new highs
  • The Cumulative Advance/Decline Line has hit a new high, but the S&P and the stocks-only A/D Line are lagging
  • The Nasdaq's new high / new low ratio is the highest it's been in years
  • The gold / silver ratio has plunged like it has only 4 other times in history
PRODUCTS
SentimenTrader
Trading Tools
Indicators & Data API
‍
Strategies & Scanner
‍
Research Reports
FREE
RESOUrCES
Simple Backtest
Calculator
Simple Seasonality
Calculator
The Kelly Criterion
Calculator
Sentiment Geo Map
‍
Public Research Reports
‍
Education
Sentiment Indicators
‍
Technical Indicators
‍
Pricing
Bundle pricing
‍
FAQ
‍
Announcements
‍
COMPANY
‍
About
‍
In the News
‍
Testimonials
‍
Client Success Stories
CONTACT
‍
General Inquiries
‍
Media Inquiries
‍
Financial Professionals Inquiries
‍
© 2026 Sundial Capital Research Inc. All rights reserved.
Setsail Marketing
TermsPrivacyAffiliate Program
Risk Disclosure: The information and tools provided are for research and analytical purposes only and are not intended as investment advice. Market analysis involves uncertainty, and outcomes may differ from expectations. Users should conduct their own due diligence and consider their individual circumstances before making any financial decisions. Past performance is not necessarily indicative of future results.

Hypothetical Performance Disclosure: Hypothetical performance results have many inherent limitations, some of which are described below. No representation is being made that any account will or is likely to achieve profits or losses similar to those shown; in fact, there are frequently sharp differences between hypothetical performance results and the actual results subsequently achieved by any particular trading program. One of the limitations of hypothetical performance results is that they are generally prepared with the benefit of hindsight. In addition, hypothetical trading does not involve financial risk, and no hypothetical trading record can completely account for the impact of financial risk of actual trading. for example, the ability to withstand losses or to adhere to a particular trading program in spite of trading losses are material points which can also adversely affect actual trading results. There are numerous other factors related to the markets in general or to the implementation of any specific trading program which cannot be fully accounted for in the preparation of hypothetical performance results and all which can adversely affect trading results.

Testimonial Disclosure: Testimonials appearing on this website may not be representative of other clients or customers and is not a guarantee of future performance or success.