
The heart of the election cycle approaches

Key points:
- The upcoming ten-month period starting October 1st is the most favorable portion of the 48-month election cycle
- Results are not always hugely profitable
- The last 20 election cycles have seen the S&P 500 Index rise during this period
The best ten months of the election cycle
If seasonality is any guide, investors are about to enjoy a persistent tailwind.
According to Investopedia, the stock market has often shown disparate performance depending on when a U.S. president is elected.
The presidential election cycle theory, developed by Stock Trader's Almanac founder Yale Hirsch, posits that equity market returns follow a predictable pattern each time a new U.S. president is elected. According to this theory, U.S. stock markets perform weakest in the first year, then recover, peaking in the third year, before falling in the fourth and final year of the presidential term, after which point the cycle begins again with the next presidential election.
The most favorable portion of the 48-month election cycle extends from the end of September of the mid-term election year and the end of July of the mid-term election year. The next favorable period extends from the close on September 30 through July of next year.
For our test, we will use month-end price data for the S&P 500 Index starting at the end of 1932. This period encompasses 22 completed four-year election cycles.
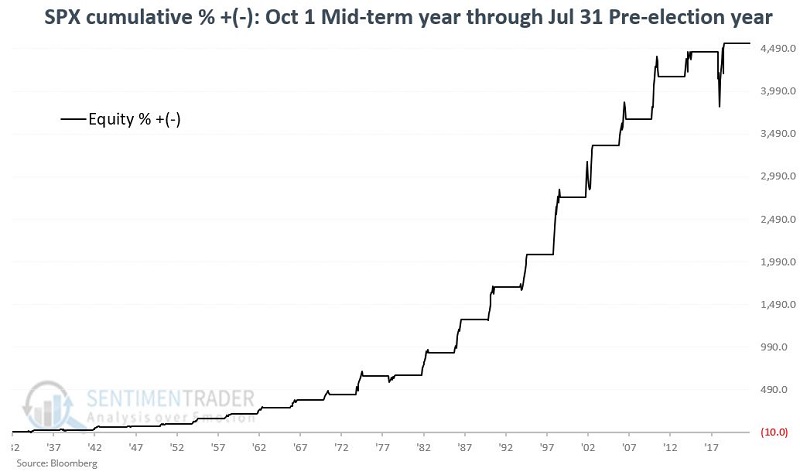
S&P performance during the Best ten months
The chart below displays the cumulative price return for the S&P 500 if held only during October of each mid-term election year through July of the following year.
To put this performance into perspective, let's compare it to the S&P performance for all other months (i.e., the remaining 38 months of each election cycle). The black line in the chart below is the same as the one in the chart above - displaying S&P 500 performance during the Best ten months. The blue line shows S&P cumulative performance if held only during all 38 other months not included in the Best ten months.
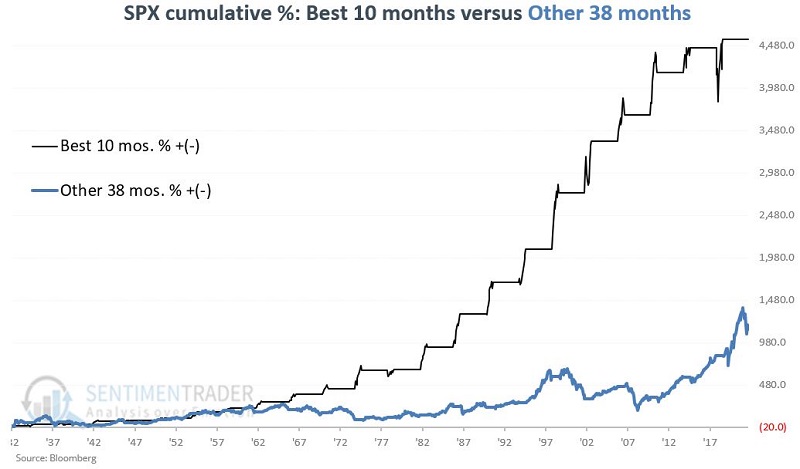
Over roughly 90 years, the cumulative return for the best ten months was +4,553% versus +1,134% for all 38 other months.
In other words, the stock market gained over four times as much during the best ten months as it did during all other months combined. It would be a mistake to label the other 38 months as bearish, but the returns are much less robust and far less consistent than during the best ten months.
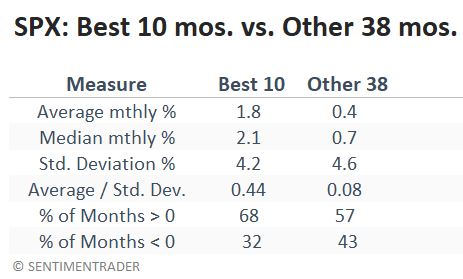
The table below compares monthly performance for the best ten months versus the Other 38 months.
Over a full cycle, the best ten months almost never lost
The chart below shows the performance for the best ten months over a full cycle.
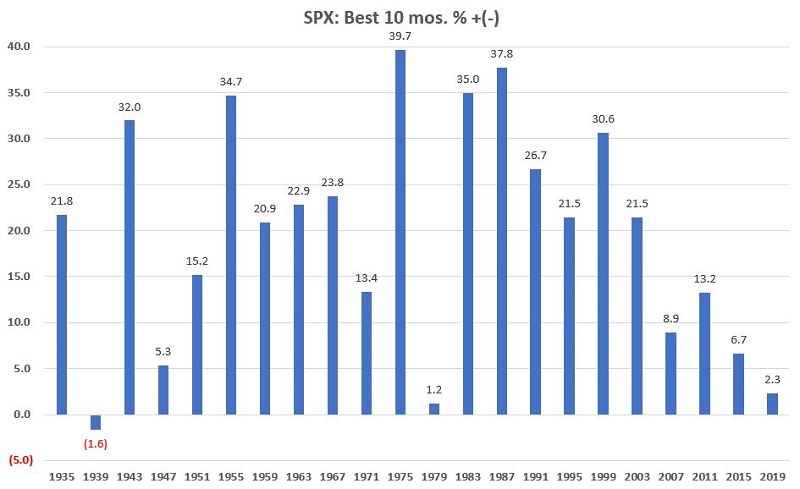
The average return was +19.7%, and the median return was +21.5%. Of the 22 completed election cycles, the best ten months have shown a gain 21 times (95% of the time) and a loss only once. That loss was a -1.6% decline during the 1938-1939 period. Since then, the best ten months have shown a gain over 20 consecutive cycles.
What the research tells us…
The results above are pretty compelling. They in no way guarantee that the stock market will advance in the ten months ahead. Still, the results strongly suggest keeping an open mind to the possibility that the stock market could and maybe even should surprise many people to the upside.