Products
SentimenTrader Trading Tools
‍
Backtest Engine
My Trading Toolkit
Correlation Analysis
Seasonality
Market Prediction
Indicators & Data API
‍
Proprietary Indicators & Charts
Market Data API
Strategies & Scanner
‍
50+ Trading Strategies
Smart Stock Scanner
Smart Option Scanner
Research Reports
‍
Research Solutions
Reports Library
Free Resources
Simple Backtest Calculator
Simple Seasonality Calculator
The Kelly Criterion Calculator
Sentiment Geo Map
Public Research Reports
Education
Sentiment Indicators
Technical Indicators
Pricing
Company
About
In the News
Testimonials
Client Success Stories
Contact
Log inLoginSign up
< BACK TO ALL REPORTS

The Headwind From Option Expiration

Jason Goepfert
2016-06-17
null

Seasonal tendencies in markets get quite a bit of attention and mostly it's due to interesting, but spurious, patterns found by combing through years of data trying to find any type of edge.

Calendar-based influences made a lot more sense in prior decades, and sometimes when there are structural changes in markets. Nowaday, if there is any seasonal bias in stocks it is most likely due to the greater fool theory - other people are trading based on these patterns so I might as well too.

We've never been a big fan of relying on these patterns, using them as tertiary inputs as best. One of them that has persisted, though, is the tendency to see some weakness following monthly option expirations, particularly those around quarter-end.

There are some explanations for this tendency, usually related to the demands of portfolio managers and market makers to adjust their exposure levels to take into account the expiration or rolling over of options positions. Regardless of the reason, the negative bias following these days has been consistent.

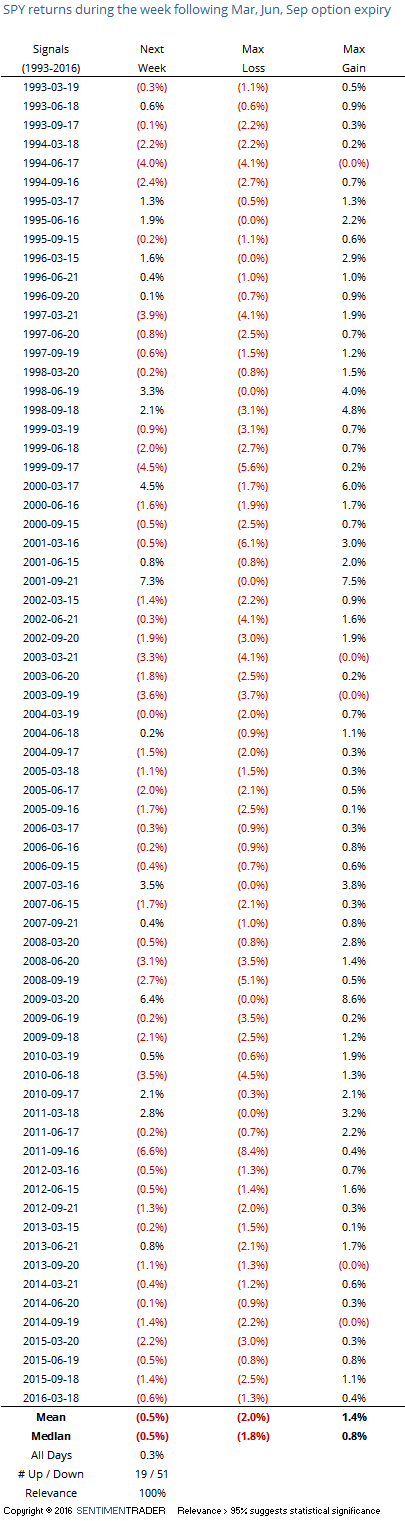
The worst performance for stocks has been the week following March, June, and September expirations. Since its inception in 1993, SPY has rallied the week after one of these expirations only 17 times out of 70 attempts. Its maximum loss at its worst point during the week was more than twice as large as its maximum gain at its best point, on average.

20160617_expiration

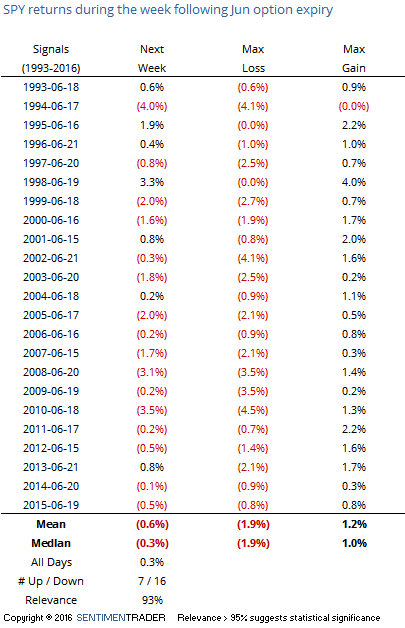
Looking at June specifically, SPY rallied 7 out of 23 times, averaging a loss of 0.3% for the week. In the past 11 years, it managed a gain only once.

20160617_expiration_june

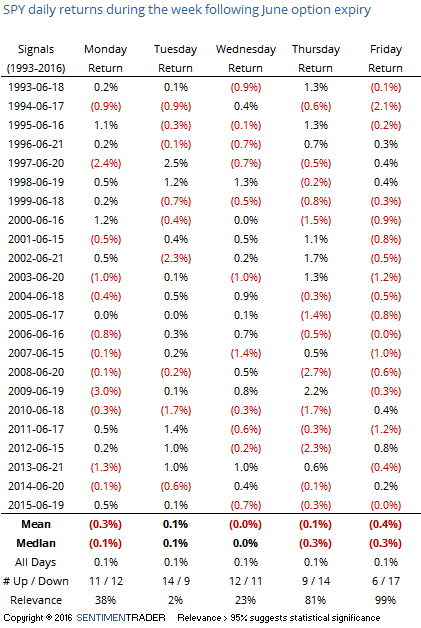
Monday tended to be a down day, followed by a mid-week bounce, then more selling heading into the end of the week.

20160617_expiration_daily

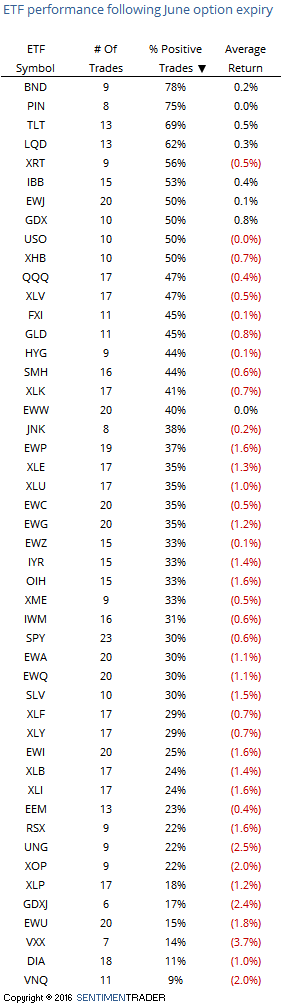
Looking through the list of most popular ETFs, it's not a big surprise that "safety" funds like bonds are the best performers. BND was up 78% of the time the week following June expiry and TLT 69% of the time.

20160617_expiration_june_etf

We would put a low weight on this data and not make any trading decisions based on it alone, though it does make it seem more questionable that some of the short-term positives that have popped up, like the tendency to see a rally following 5 straight down days, will succeed.

PRODUCTS
SentimenTrader
Trading Tools
Indicators & Data API
‍
Strategies & Scanner
‍
Research Reports
FREE
RESOUrCES
Simple Backtest
Calculator
Simple Seasonality
Calculator
The Kelly Criterion
Calculator
Sentiment Geo Map
‍
Public Research Reports
‍
Education
Sentiment Indicators
‍
Technical Indicators
‍
Pricing
Bundle pricing
‍
FAQ
‍
Announcements
‍
COMPANY
‍
About
‍
In the News
‍
Testimonials
‍
Client Success Stories
CONTACT
‍
General Inquiries
‍
Media Inquiries
‍
Financial Professionals Inquiries
‍
© 2026 Sundial Capital Research Inc. All rights reserved.
Setsail Marketing
TermsPrivacyAffiliate Program
Risk Disclosure: The information and tools provided are for research and analytical purposes only and are not intended as investment advice. Market analysis involves uncertainty, and outcomes may differ from expectations. Users should conduct their own due diligence and consider their individual circumstances before making any financial decisions. Past performance is not necessarily indicative of future results.

Hypothetical Performance Disclosure: Hypothetical performance results have many inherent limitations, some of which are described below. No representation is being made that any account will or is likely to achieve profits or losses similar to those shown; in fact, there are frequently sharp differences between hypothetical performance results and the actual results subsequently achieved by any particular trading program. One of the limitations of hypothetical performance results is that they are generally prepared with the benefit of hindsight. In addition, hypothetical trading does not involve financial risk, and no hypothetical trading record can completely account for the impact of financial risk of actual trading. for example, the ability to withstand losses or to adhere to a particular trading program in spite of trading losses are material points which can also adversely affect actual trading results. There are numerous other factors related to the markets in general or to the implementation of any specific trading program which cannot be fully accounted for in the preparation of hypothetical performance results and all which can adversely affect trading results.

Testimonial Disclosure: Testimonials appearing on this website may not be representative of other clients or customers and is not a guarantee of future performance or success.