
The Hang Seng is hanging in there

Key points:
- Most stocks in the Hang Seng are now in medium-term uptrends
- For the first time in months, more than 8% of the stocks have hit 52-week highs
- That is mostly constructive behavior for forward returns, especially with copper hitting multi-month highs
Most Chinese stocks are in medium-term uptrends
We've seen this movie before. Chinese stocks spike, everyone gets excited, they tank, everyone forgets about them, then they spike again.
While "Chinese stocks" mean different things to different people, the Hang Seng index is one of the main gauges. And like we saw with developed European stocks recently, stocks in the Hang Seng are enjoying broad participation in the latest advance.
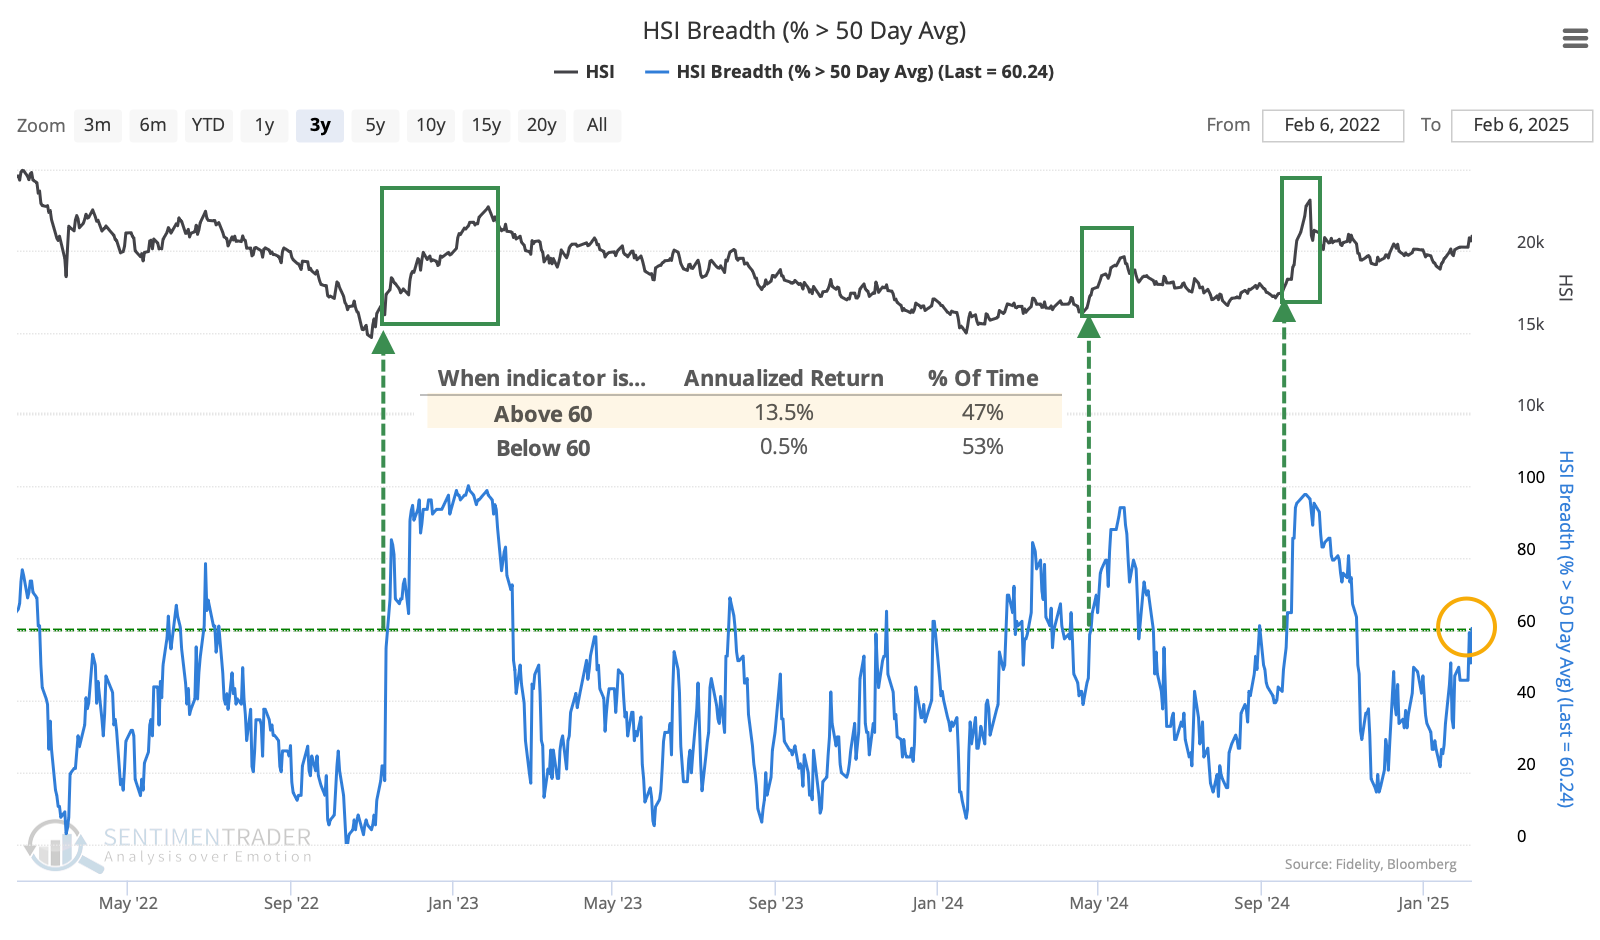
For the first time in months, more than 60% of stocks in the index are trading above their 50-day moving average. When that's the case, the annualized return in the Hang Seng has been +13.5%, versus only +0.5% when the indicator is below that threshold. The last three major sustained rallies in the index started just as this indicator broke above 60%.
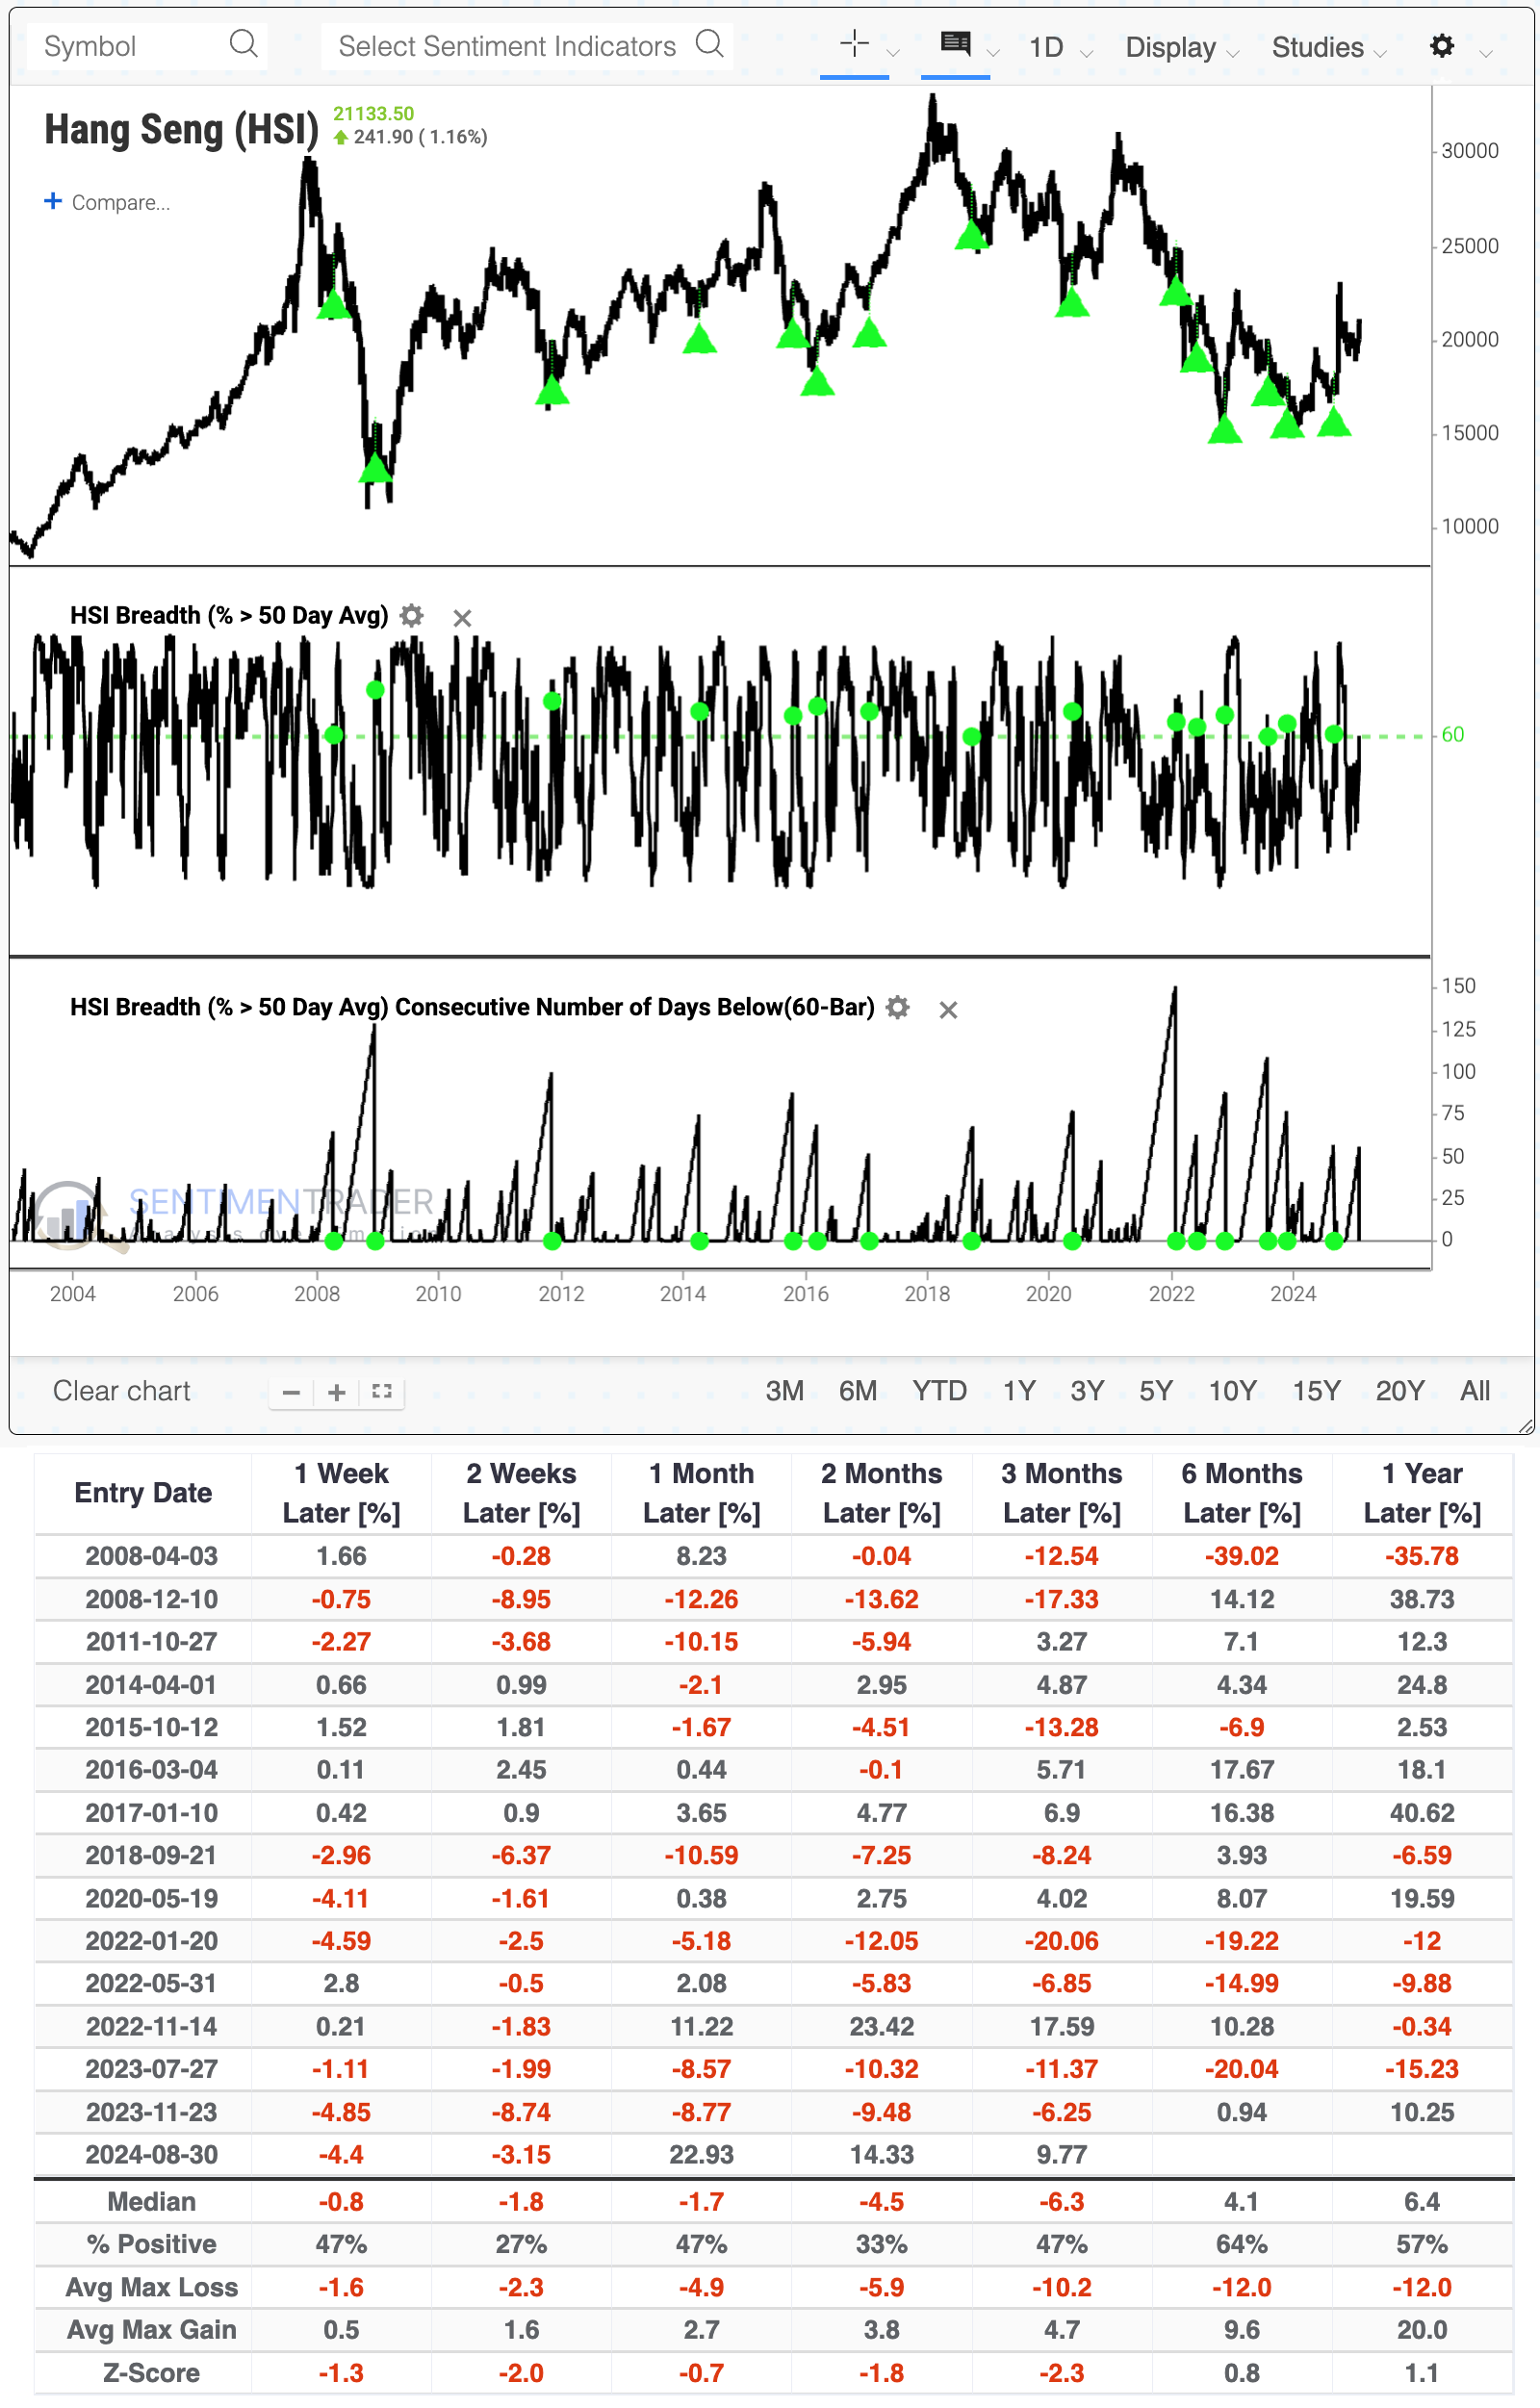
As we've seen so often, however, this boom-and-bust market has frequently had difficulty holding onto positive momentum. According to Backtest Engine 2.0 (click here to load the test, then click the Run Backtest button), when more than 60% of Hang Seng members trade above their 50-day average after having gone several months with fewer than that, the Hang Seng has struggled, especially over the next couple of weeks.
More new highs
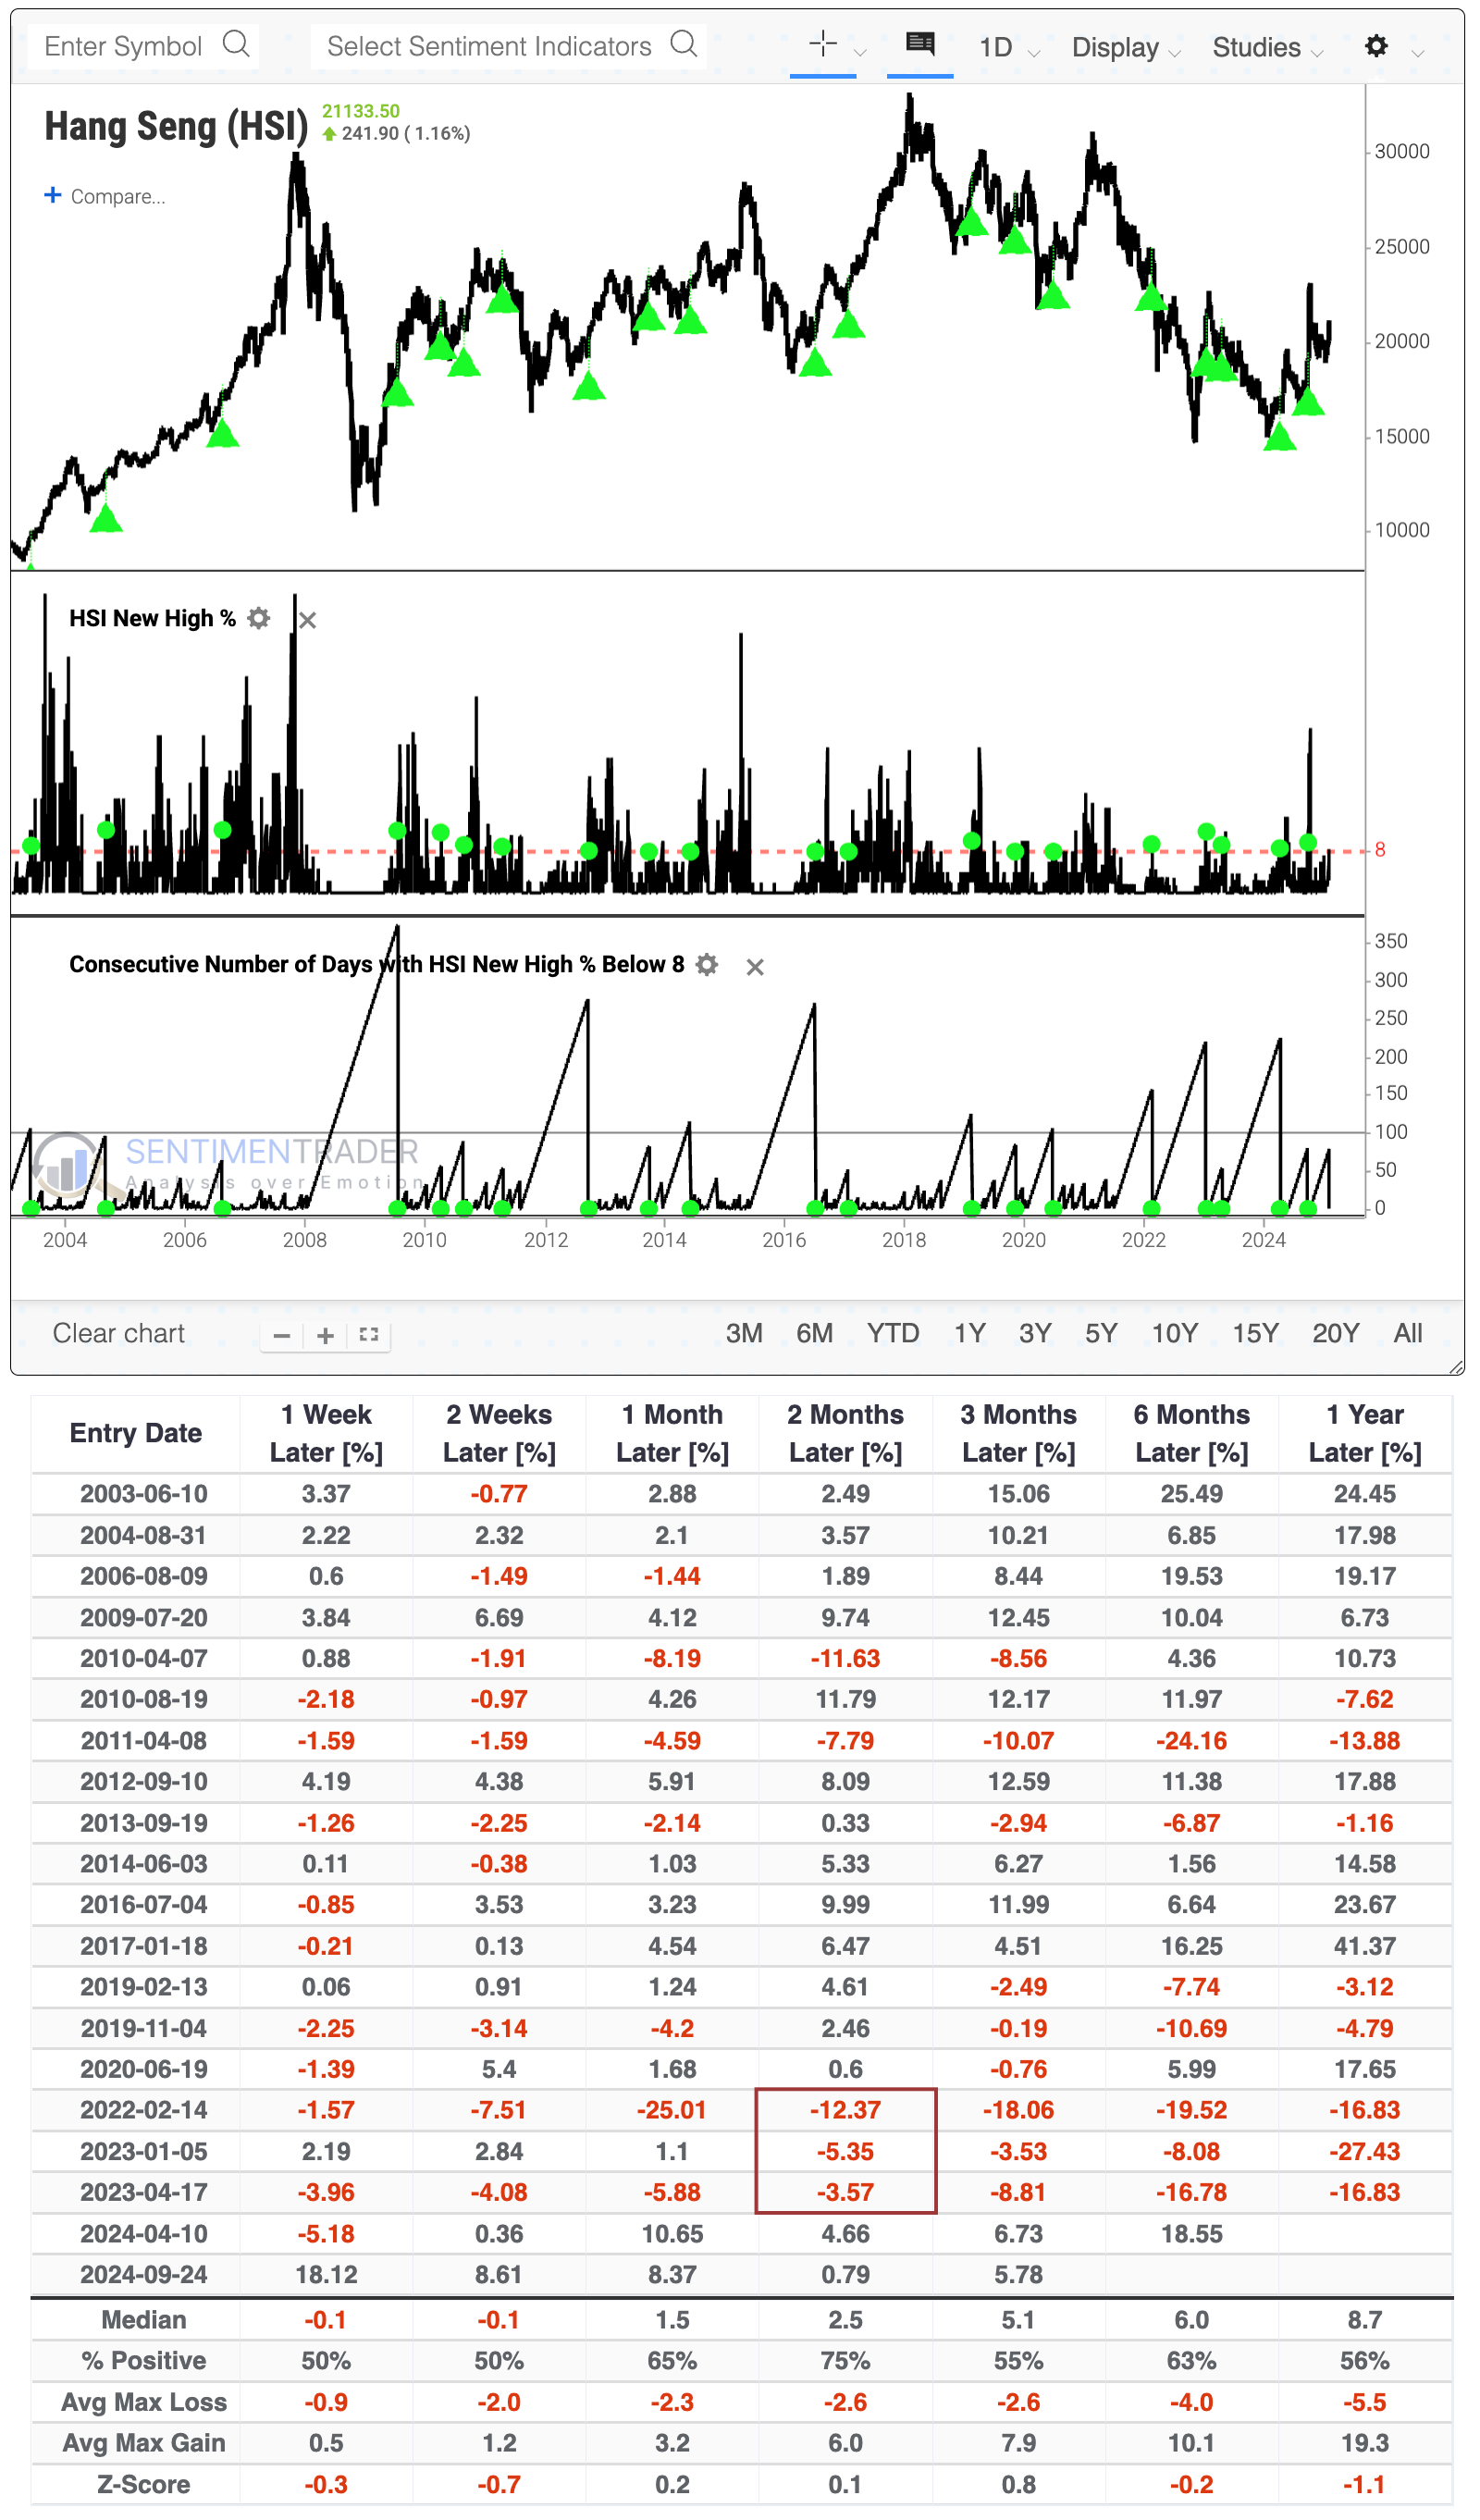
While the medium-term push is notable, it's more encouraging that some longer-term indicators are also looking up. For the first time in months, more than 8% of stocks in the Hang Seng have reached a 52-week high (click here to load the backtest).
Below, we can see that this was more constructive for the index. Over the next two months, the Hang Seng rallied 75% of the time, with three failures clustered during 2022-23. Outside that window, 15 of the 17 signals sported a positive return.
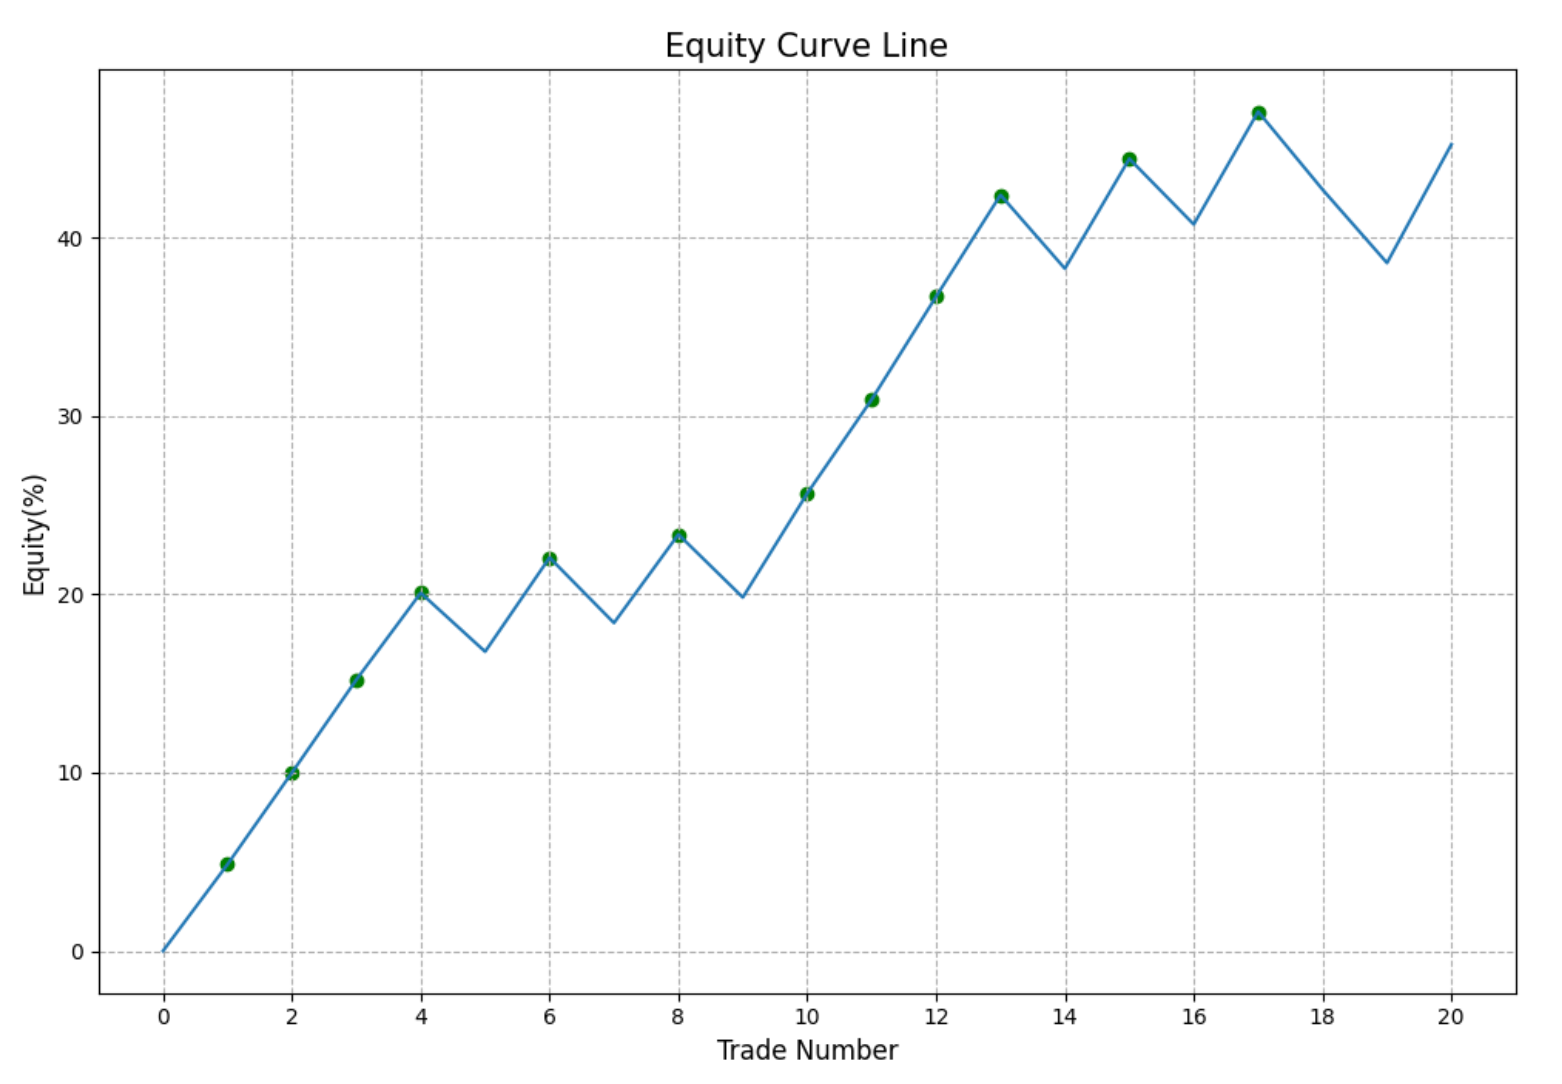
If you run the test and look at the maximum gains and losses table, you'll see that most of the winners didn't see much of a drawdown, while most of the losers lost immediately. Another way of looking at the test is setting stop losses and profit targets. If we adjust the test to buy the Hang Seng when more than 8% of members hit a new high and exit at either a 3% loss or 5% gain, we get the equity curve below.
The "up and to the right" shape tells us that after these signals, there was a general bias toward quick 5% gains as opposed to 3% losses.
Copper rising
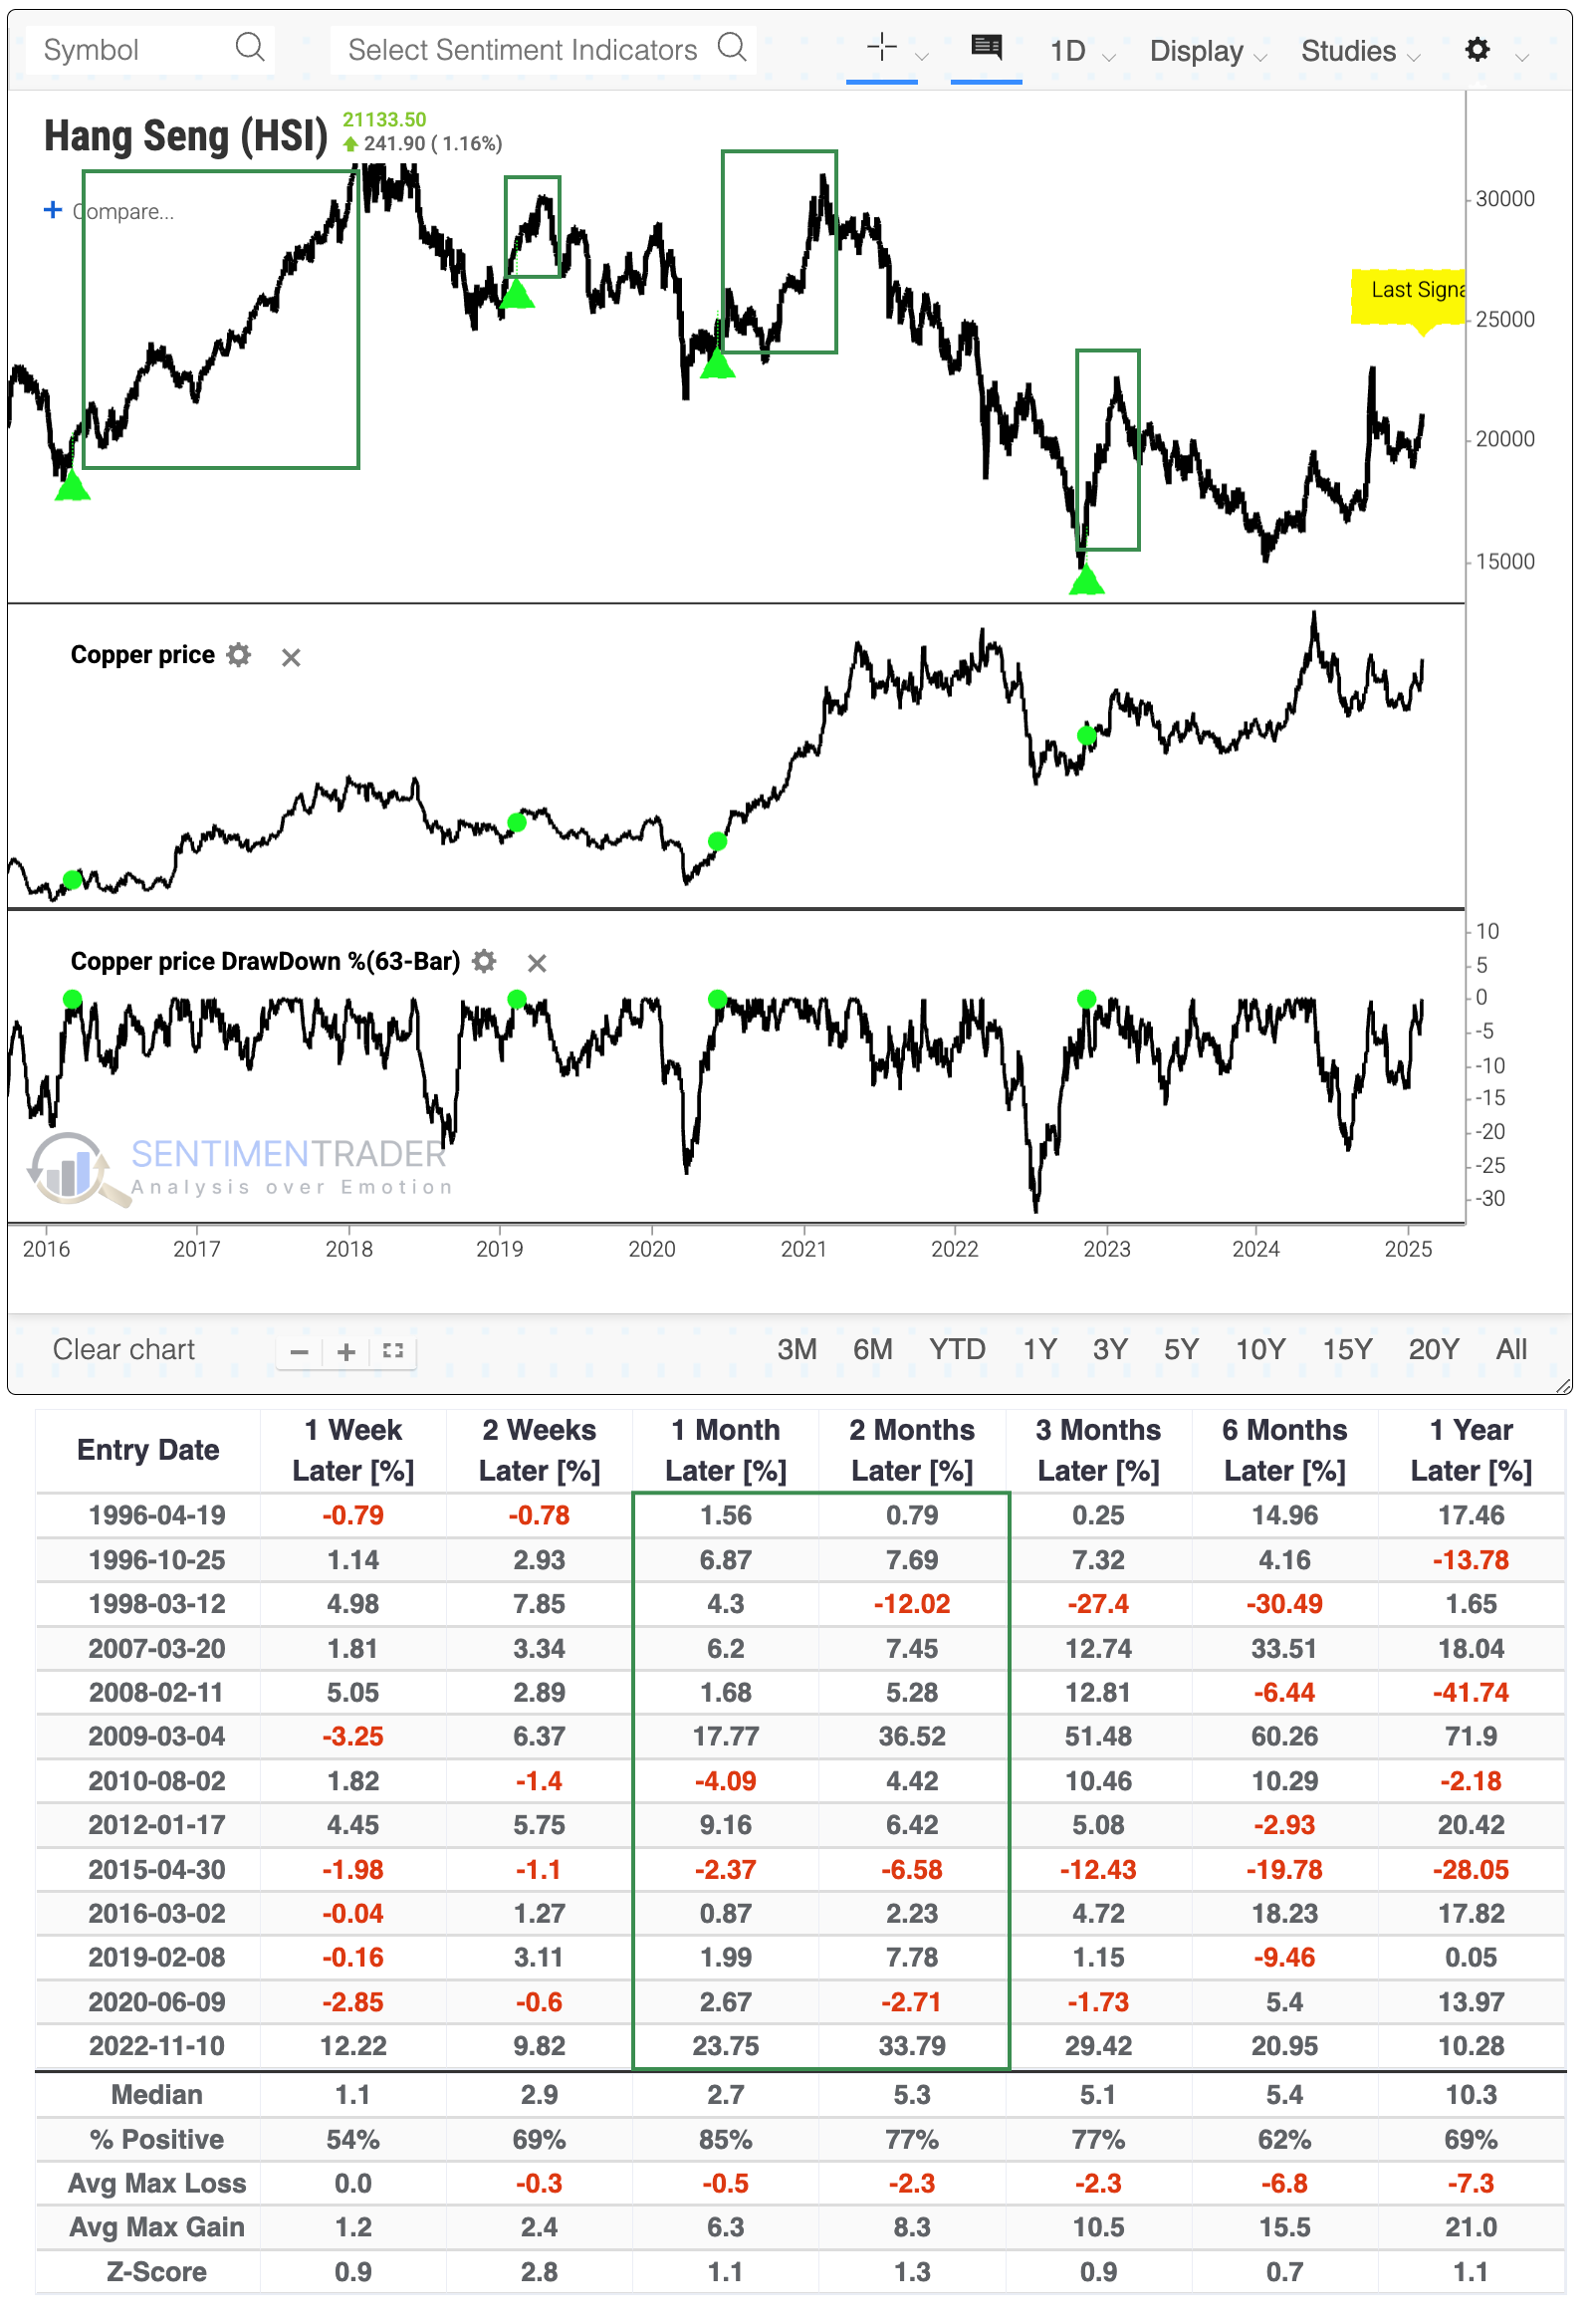
While not directly related to the Hang Seng or China writ large, it's interesting that copper prices are rallying strongly. Copper is often used as a proxy for Chinese economic conditions because China is the world's largest copper consumer.
The backtester shows us that copper was recently more than 20% below its 3-month high but has stormed back and is now trading at its highest price in months. Over the past decade, these copper recoveries have preceded some of the best rallies in the Hang Seng. Even over the past 30 years, the Hang Seng showed a positive return either one or two months later every time but once.
What the research tells us...
We've often noted that the Chinese stock market, like gold mining stocks, marches to its own drummer. They don't adhere to the heuristics that most other sectors and market indices tend to follow. One of those is momentum - once those two markets suck in buyers, they tend to either take off on once-a-half-decade momentum runs or (more often) roll over almost immediately and generate capital losses.
It's not a perfect indicator by any stretch, but we can usually take a cue from short-term performance. If buyers continue to show interest in these markets over the next week or two, that generally bodes well for longer-term returns. That will be something to watch in the coming week(s) for the Hang Seng and the broader universe of Chinese stocks.