
The growth-to-value ratio breaks out to a 9-month high

Key points:
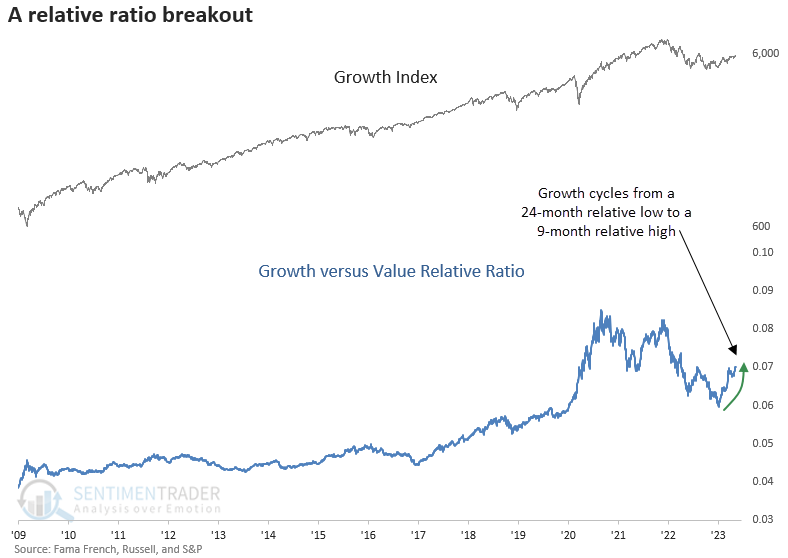
- The growth-to-value relative ratio registered its first 9-month high after a 24-month low
- Similar reversals in the relationship preceded a steady upward bias for growth-oriented stocks
- A comparison between the two factors suggests a slight edge for growth
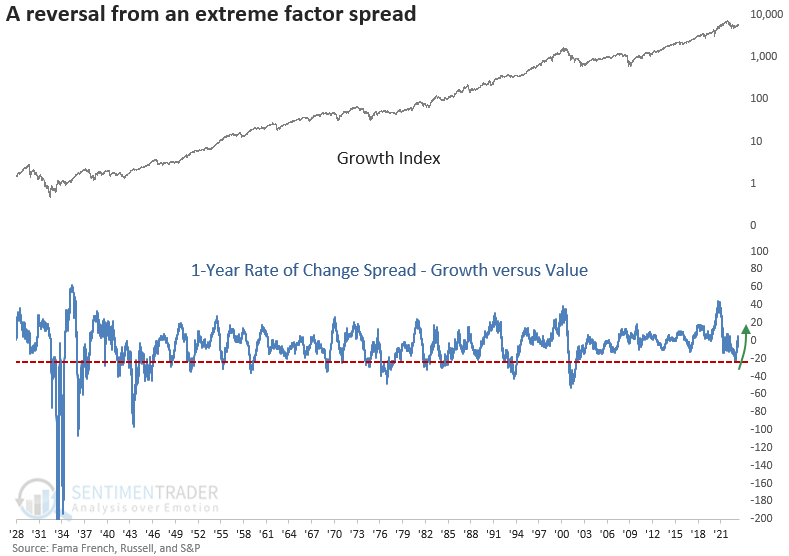
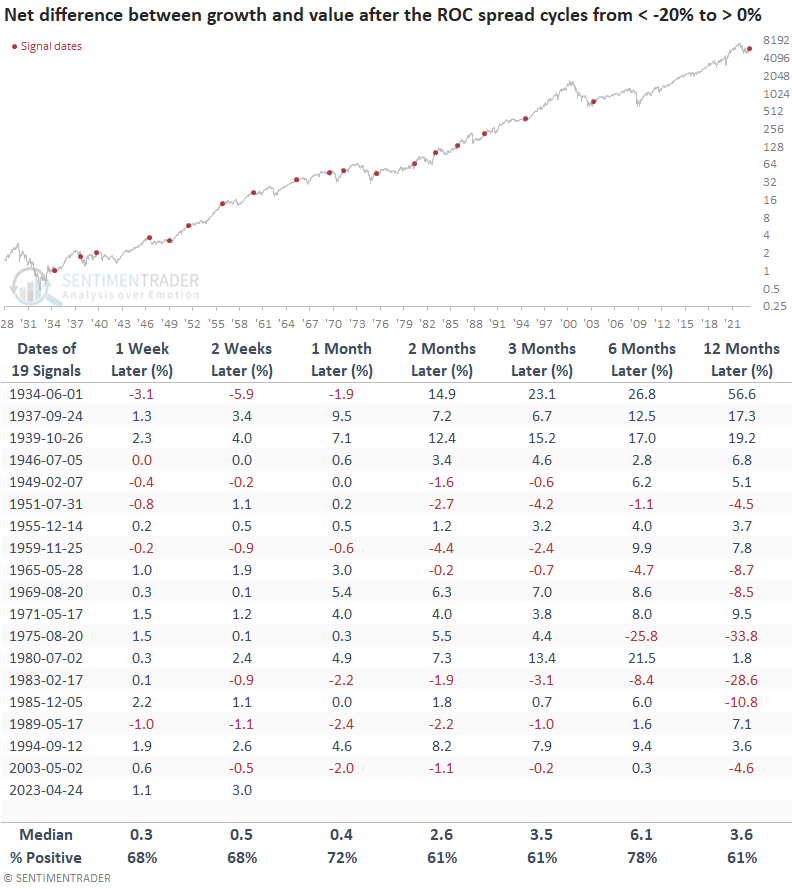
- The 1-year roc spread between growth and value cycled from <-20% to > 0%, bolstering the case for growth
Can growth-oriented stocks continue to outperform value stocks
With a potential peak in interest rates and inflation looking more likely, growth stocks, which got hammered in 2022 when both characteristics were unfriendly, look poised to continue to outperform the value factor.
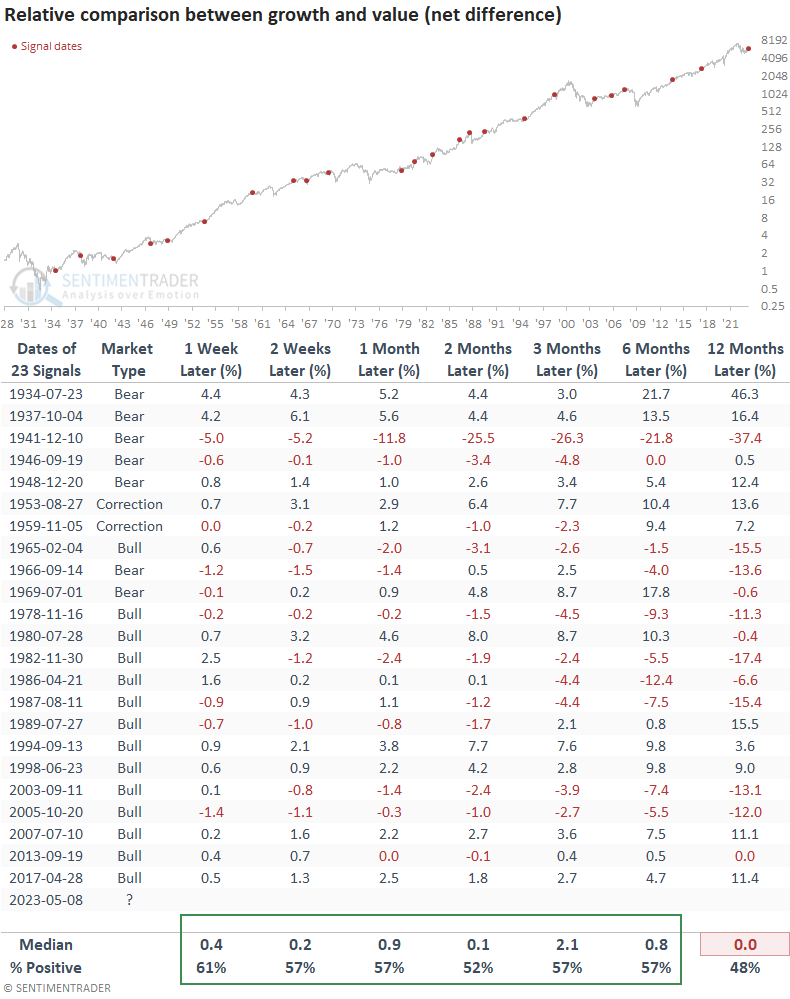
For only the 24th time since 1934, the growth-to-value relative ratio registered its first 9-month high after a 24-month low. The previous breakout in the ratio occurred in 2017, leading to solid relative outperformance by growth over the next year.
The breakout in the ratio comes after the worst 1-year rate of change spread contractions since the Dotcom bust.
Similar breakouts preceded positive returns
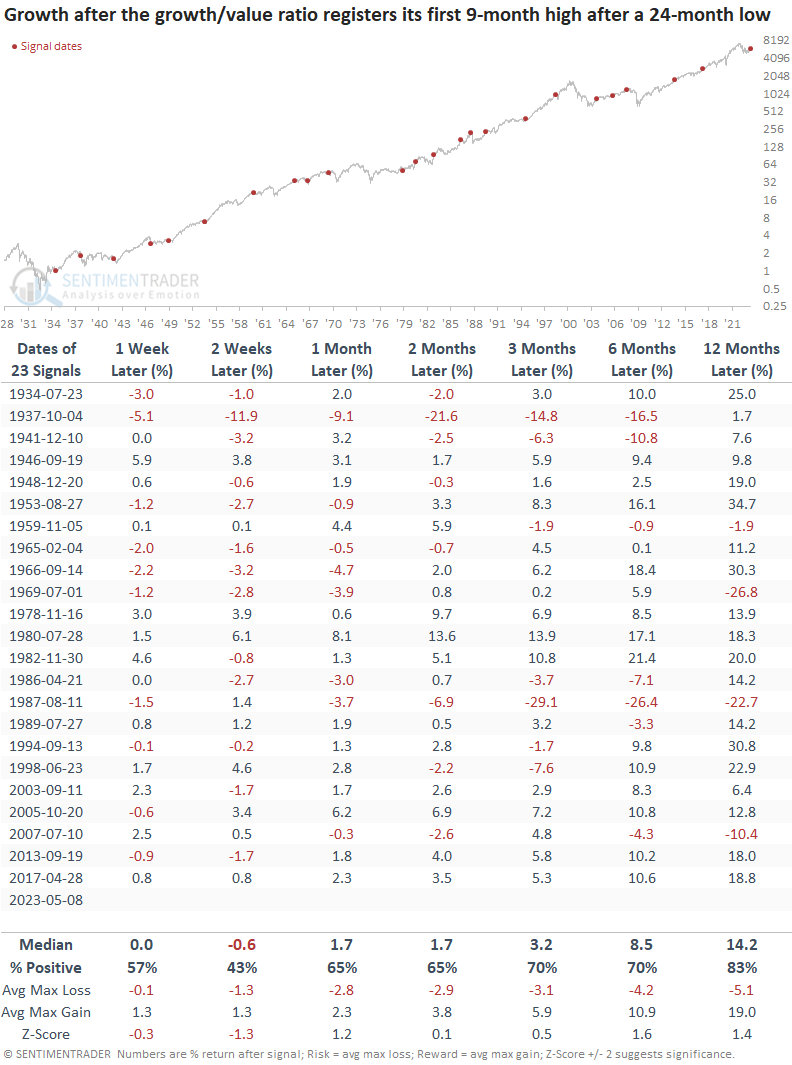
Growth stocks tend to rise steadily over time when the growth-to-value ratio records its first 9-month high after a 24-month low. Except for an untimely signal ahead of the 1987 crash, most unfavorable precedents occurred before the peak in interest rates in 1981.
While win rates look similar to the growth, value returns show a flat outlook over the next three months.
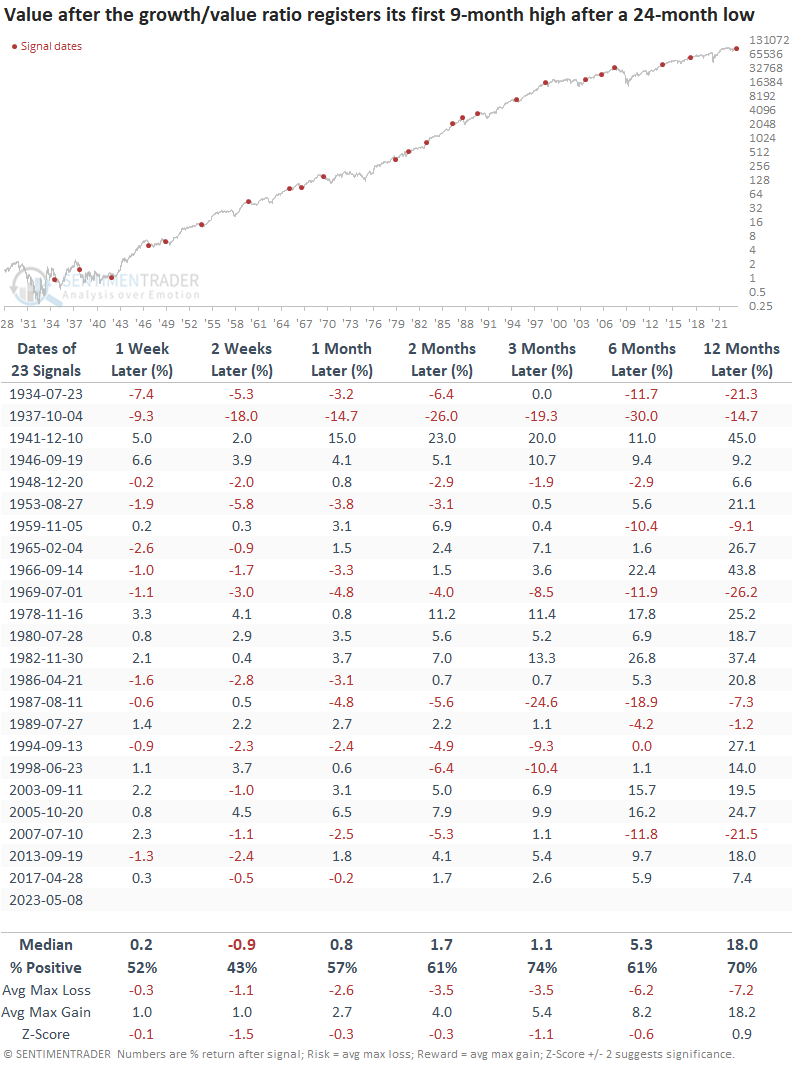
When I compare the two factors, growth shows a slight edge over value across most short and medium-term time frames. A year later, it was a coin toss between the two groups. However, growth struggled in the 12-month horizon during the inflation-driven secular bear market from 1966 to 1982.
Interestingly, most signals before 1978 occurred in bear markets or large corrections. However, that trend has changed as the reversal in the ratio now shows a strong tendency to take place in bull markets.
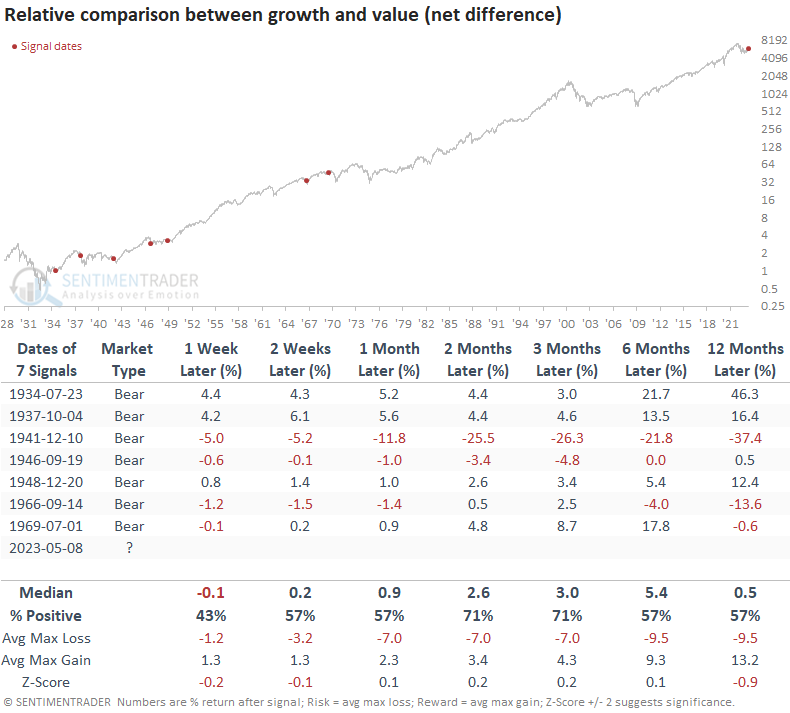
Bear Market Signals
Suppose we assume we're still in a bear market. In that case, signals that occurred during a drawdown phase showed a slightly more favorable outlook for growth over value.
The 1-year rate of change spread
Let's assess the outlook for growth stocks based on the indicator in the second chart in today's note.
When the 1-year rate of change spread between growth and value cycles from < -20% to > 0%, growth shows a solid tendency to outperform value across all time frames.
What the research tells us...
For the first time since 2017, the growth-to-value relative ratio reversed from a 24-month low to a 9-month, triggering a bullish signal for growth stocks. And the 1-year rate of change spread between the two factors bolsters the case for a growth-over-value portfolio tilt when it cycled from < -20% to > 0%. With more evidence on the bullish side of the growth ledger, the factor looks poised to continue its outperformance relative to value.