Products
SentimenTrader Trading Tools
‍
Backtest Engine
My Trading Toolkit
Correlation Analysis
Seasonality
Market Prediction
Indicators & Data API
‍
Proprietary Indicators & Charts
Market Data API
Strategies & Scanner
‍
50+ Trading Strategies
Smart Stock Scanner
Smart Option Scanner
Research Reports
‍
Research Solutions
Reports Library
Free Resources
Simple Backtest Calculator
Simple Seasonality Calculator
The Kelly Criterion Calculator
Sentiment Geo Map
Public Research Reports
Education
Sentiment Indicators
Technical Indicators
Pricing
Company
About
In the News
Testimonials
Client Success Stories
Contact
Log inLoginSign up
< BACK TO ALL REPORTS

The first sign of an oversold condition

Dean Christians
2022-09-06
The stochastic oscillator, which measures overbought or oversold conditions, can be applied to a group of stocks to measure participation. Last week, the number of S&P 500 stocks with a stochastic oscillator of less than 20 surged above 73%, triggering a buy signal for a voting member in the composite washout model.

Key points:

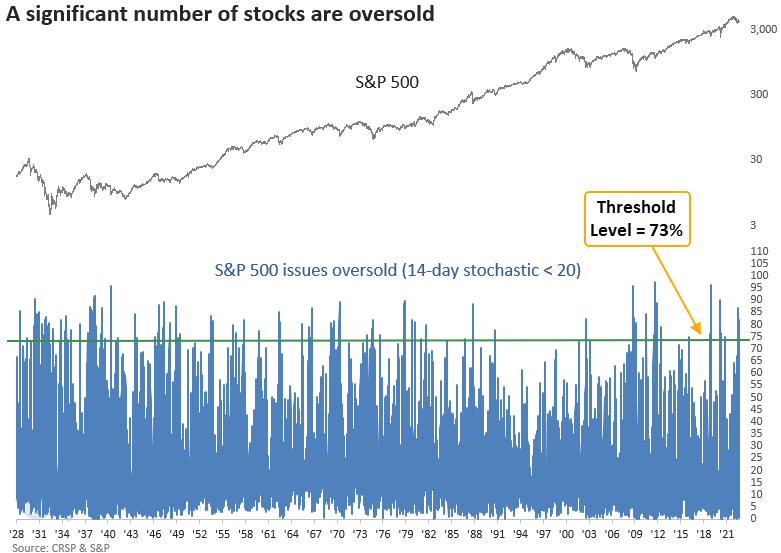
  • S&P 500 issues with a 14-day stochastic oscillator of < 20 exceeded 73%
  • The weak breadth triggered a signal from a member in the composite washout model
  • After similar breadth-based conditions, stocks showed a positive upward bias

Market breadth is starting to show signs of an oversold condition

The Stochastic Oscillator (Stochastic for short), created by George Lane, is a popular technical indicator found in most charting applications. The Stochastic identifies overbought or oversold conditions by measuring the closing price of a security to a range of prices over a lookback period. 

The indicator can be applied to a group of securities to measure the breadth of participation. In a recent note, I shared how I use the percentage of issues with a Stochastic > 80 to identify bullish momentum. 

With stock indexes retracing a significant portion of the recent rally, most stocks are now showing an oversold condition based on the 14-day Stochastic. Last week, the number of oversold stocks (14-day Stochastic < 20) in the S&P 500 exceeded 73%, triggering a new signal from a member in the Composite Washout Model. 

Similar breadth-based conditions preceded positive returns

The Stochastic Oscillator model generated a signal 91 other times over the last 95 years. Returns had an upward bias, with the three-month time frame showing the best win rate and z-score. The previous signal from June closed out the 5th best two-month return in history. 

Context is important, and currently, the S&P 500 is mired in a long-term downtrend. Its 200-day average has declined for at least 90 consecutive days.

If we add that condition to the study, it identified 26 other instances. Once again, returns show an upward bias, with the best win rate and z-score coming a month later. The two and three-month windows suggest a potential retracement after the initial bounce. 

Results look excellent a year later post the 1929-32 bear market. 

Composite Washout Model Signal Count 

After triggering a Composite Washout Model signal in June, the S&P 500 rallied slightly over 12% before the index peaked in mid-August. Since the peak, stock indexes have retreated at an alarming rate and now show the first sign of an oversold condition as measured by a Composite Washout Model member. 

The model remains well below the threshold level for generating another signal.

What the research tells us...

Stock indexes have been in a relentless short-term downtrend since the August peak, with 9 out of 13 sessions showing a decline for the S&P 500. The slump in stocks triggered a new signal from a voting member in the composite washout model. While the signal results look constructive, we don't see an overwhelming bullish bias that suggests one should rush in with a sense of urgency to buy stocks. A better strategy might be to wait for additional evidence of an oversold condition, which could produce a more compelling outlook. 

PRODUCTS
SentimenTrader
Trading Tools
Indicators & Data API
‍
Strategies & Scanner
‍
Research Reports
FREE
RESOUrCES
Simple Backtest
Calculator
Simple Seasonality
Calculator
The Kelly Criterion
Calculator
Sentiment Geo Map
‍
Public Research Reports
‍
Education
Sentiment Indicators
‍
Technical Indicators
‍
Pricing
Bundle pricing
‍
FAQ
‍
Announcements
‍
COMPANY
‍
About
‍
In the News
‍
Testimonials
‍
Client Success Stories
CONTACT
‍
General Inquiries
‍
Media Inquiries
‍
Financial Professionals Inquiries
‍
© 2026 Sundial Capital Research Inc. All rights reserved.
Setsail Marketing
TermsPrivacyAffiliate Program
Risk Disclosure: The information and tools provided are for research and analytical purposes only and are not intended as investment advice. Market analysis involves uncertainty, and outcomes may differ from expectations. Users should conduct their own due diligence and consider their individual circumstances before making any financial decisions. Past performance is not necessarily indicative of future results.

Hypothetical Performance Disclosure: Hypothetical performance results have many inherent limitations, some of which are described below. No representation is being made that any account will or is likely to achieve profits or losses similar to those shown; in fact, there are frequently sharp differences between hypothetical performance results and the actual results subsequently achieved by any particular trading program. One of the limitations of hypothetical performance results is that they are generally prepared with the benefit of hindsight. In addition, hypothetical trading does not involve financial risk, and no hypothetical trading record can completely account for the impact of financial risk of actual trading. for example, the ability to withstand losses or to adhere to a particular trading program in spite of trading losses are material points which can also adversely affect actual trading results. There are numerous other factors related to the markets in general or to the implementation of any specific trading program which cannot be fully accounted for in the preparation of hypothetical performance results and all which can adversely affect trading results.

Testimonial Disclosure: Testimonials appearing on this website may not be representative of other clients or customers and is not a guarantee of future performance or success.