
The first real test for high-yield bonds

Key points:
- High-yield bonds suffered heavy selling pressure earlier in April, which has since ebbed
- This is the first real pullback since the December/January surge in buying
- Similar pullbacks after spikes in buying preceded months of further buying interest
Selling pressure flows, then ebbs
The mini-freakout that gave investors paroxysms in the first half of April wasn't limited to the stock market. Its close cousin in the bond market, high-yield debt, also gave holders reason to reach for the anti-anxiety medication.
When that market showed strong signs of recovering from a disastrous couple of years in January, it looked like things were pointing higher long-term. The sample size here is laughably small, but we can only work with the data we can get.
Since January, high-yield bonds, as measured by the popular HYG fund, have gone essentially nowhere. And that's not terribly unusual, either.
Earlier in the month, selling pressure was heavy enough to push the McClellan Oscillator to an exceptionally oversold reading, which has since recovered to near neutral. The handful of other times it has cycled like this, more of a recovery was in store, though there was a failure in 2022.
The results below are from using Backtest Engine v2.0 and using the time-ordered multi-condition function to see what happens when the Oscillator cycles from below -85 to crossing above -10. There was only one failure when it triggered too early before the fall 2022 bottom.
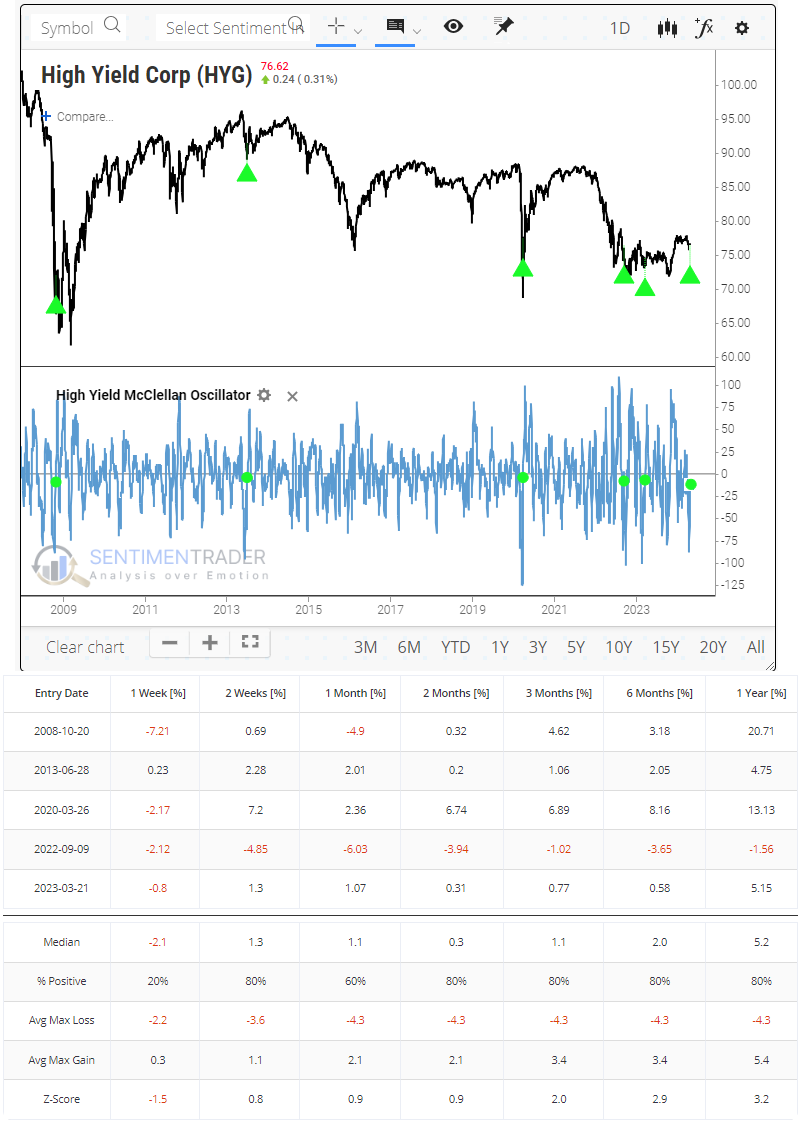
This is the first real pullback in these bonds since the December/January thrust. The plunge in the Oscillator means that the McClellan Summation Index also fell, and it has now fully cycled from one of the highest readings in 16 years all the way back to zero.
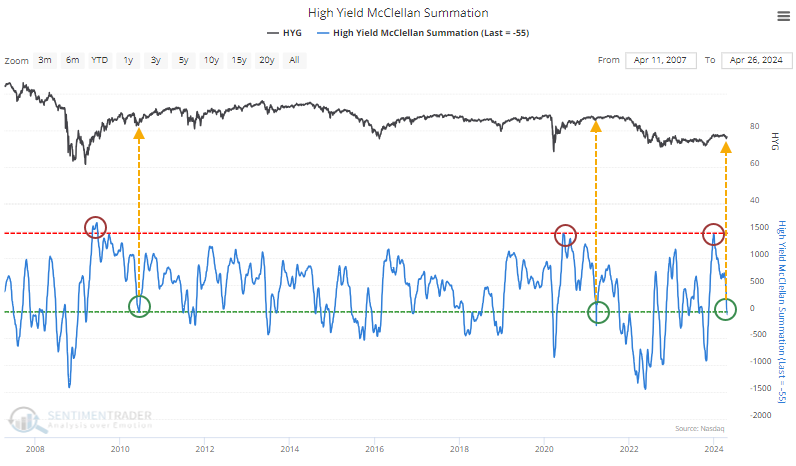
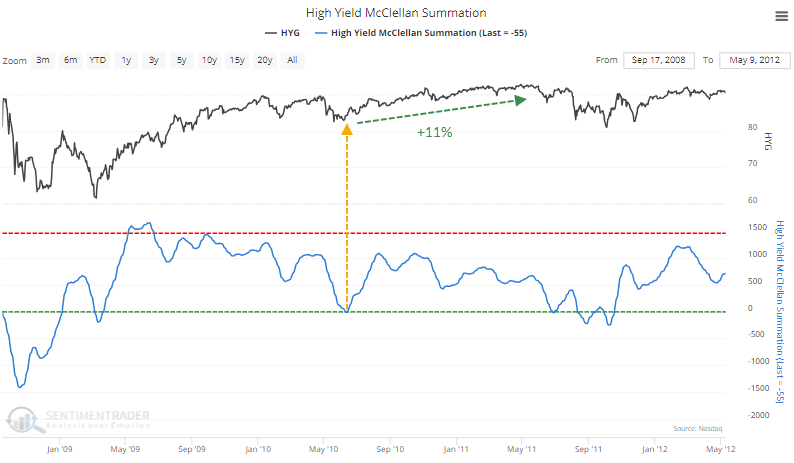
Both times the indicator cycled like this, HYG ultimately rolled over into a rough patch. But that was not before 6-8 months of further recovery. In 2010-11, that was more than +11%.
In 2021, the recovery was only about +3%, but it was a slow and steady rise before tipping into a disastrous 2022.

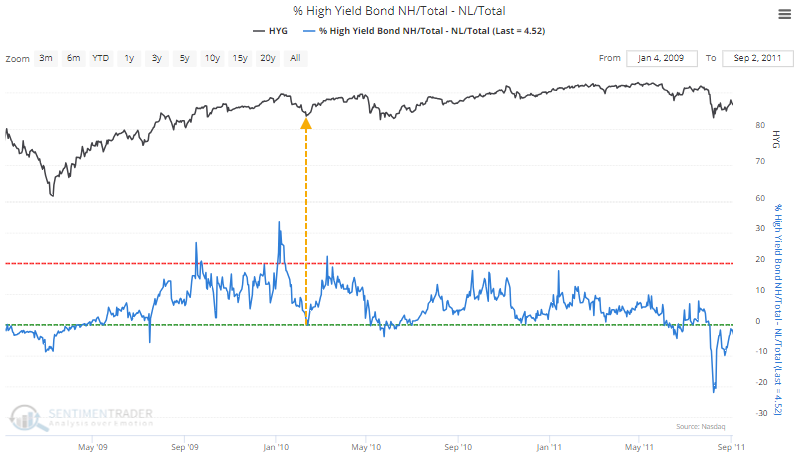
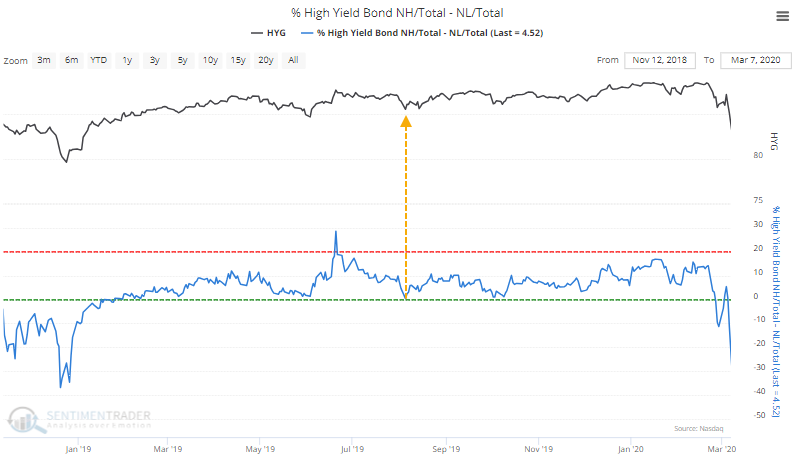
New highs fall back
We see similar behavior in the percentage of bonds that recovered to a 52-week high. That spiked to a historic level of more than 20% of the high-yield bond market in mid-December and just recently fell back to par. Again, there are only a couple of precedents.
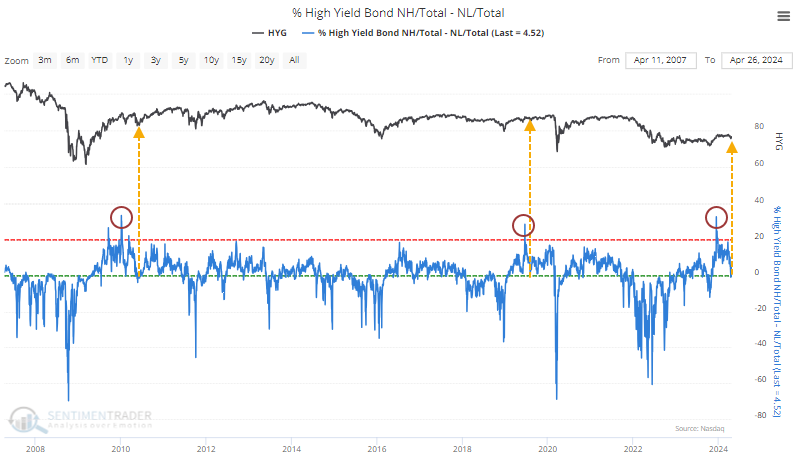
The first was the same general initial recovery following the surge after the 2008 financial crisis. While bonds did snap back after the indicator returned to neutral, there was one more pullback before a more lasting rally.
The other, in 2019, bottomed right away, and HYG climbed a couple of percentage points, but then we ran into the buzzsaw of the pandemic shutdowns, a painful couple of months for high-yield bondholders.
What the research tells us...
Now that the mini-panic from a couple of weeks ago has subsided, traders are left wondering whether it was just a sign of things to come as macro concerns loom or just a garden-variety bout of profit-taking following a tremendous post-crash surge. Limited historical data makes it hard to have much confidence in any conclusions. Still, from the cycles we've seen over nearly two decades, behavior so far is in line with other crashes-then-surges. The couple of times it has occurred, buyers found this first real dip to be a buying opportunity that lasted for months and at least a few percentage points.