
The fewest losing streaks in history


Despite the pandemic, recession, and record unemployment, the year 2020 has been the most consistently positive year in history.
Strategist Callie Cox noted that this year has seen only 32 days that were mired in a losing streak, defined as back-to-back losing sessions. On a rolling one-year basis, this is the lowest in history.
The chart shows us that there is a contrary bias to this data. Returns following periods with many losing streaks were relatively high; returns following few losing streaks were relatively low.
If we look at this on a calendar-year basis, then we're currently on trading day #242 of the year. Again, no other year has had so few losing streaks this far into the calendar since 1928.
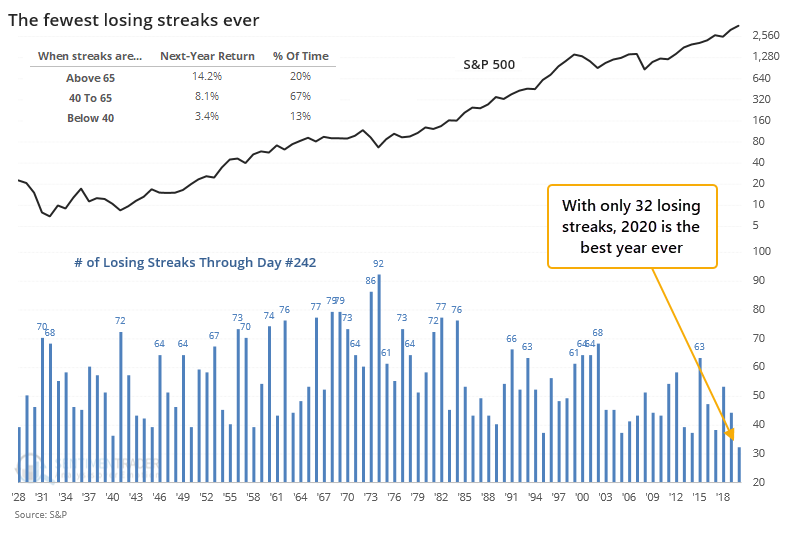
We can see from the chart that the S&P's next-year return averaged +14.2% after years with the most losing streaks, versus only +3.4% after years when there were few of them. That makes sense, as stocks meander from one extreme to the other, and it's even starker than the returns we saw in the first chart.
Below, we can see the index's forward returns after the 20 years with the fewest losing streaks, as of trading session #242.
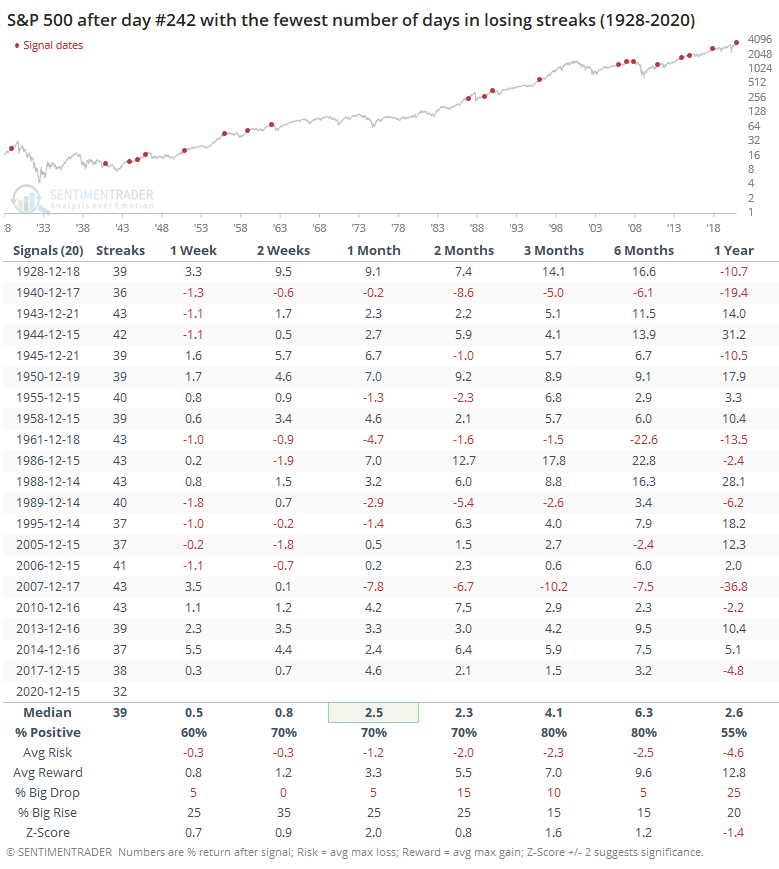
When we combine positive seasonality with strong momentum, good things tend to happen, at least over a medium-term time frame. The S&P 500's forward returns were strong during the next 1-3 months, with a good risk/reward ratio. None of it was exceptional, but at least it had a positive bias.
Now let's look at returns after the years with the most losing streaks to see if there's much of a difference.
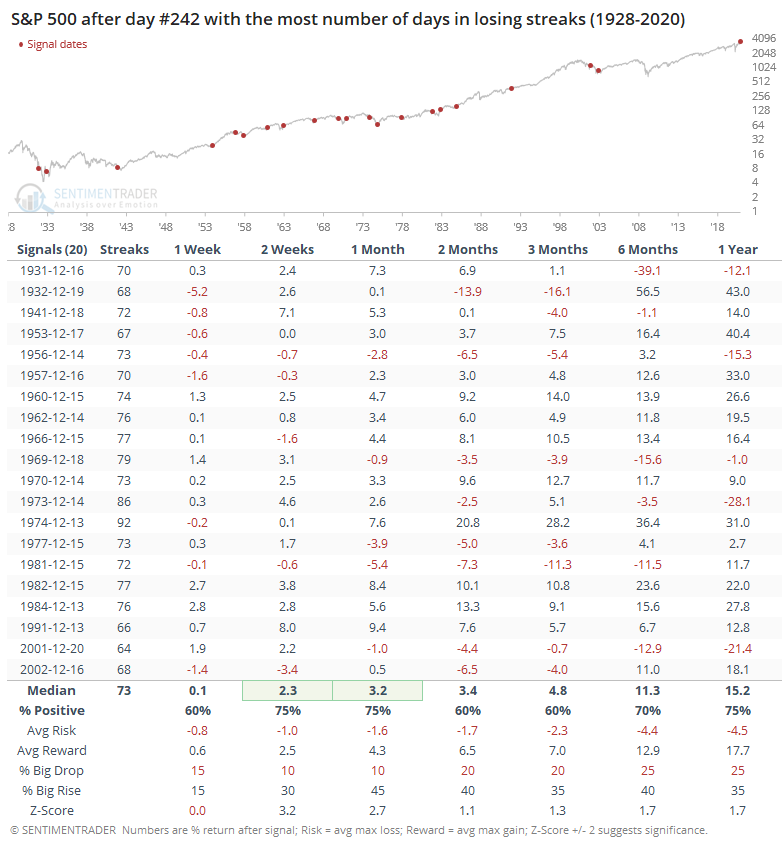
Here, returns were even stronger over the next 2-4 weeks, and much better during the next year. The percentage of time the S&P showed a gain was a little weaker over the next 2-6 months, but all the other metrics were stronger than those years with few losing streaks.
The suggestion is that during years when investors suffered, the last couple weeks of December and the first couple of January tended to do better than after those years when winning was "easy," like this year.
Overall returns after all the signals were decent, which speaks more to the idea of positive seasonality than it does persistent momentum. It's just not very common to see large, protracted declines during this time of year, even if those who traded during 2018 would scream their objection.
This year is unlike any other, with record optimism on some measures battling record momentum on others. The calendar would further argue that bulls, and momentum, have the temporary advantage.