Data &
Technology
Research
Reports
Report Solutions
Reports Library
Actionable
Strategies
Free
Resources
Simple Backtest Calculator
Simple Seasonality Calculator
The Kelly Criterion Calculator
Sentiment Geo Map
Public Research Reports
Free Webinar
Pricing
Company
About
Meet Our Team
In the News
Testimonials
Client Success Stories
Contact
Log inLoginSign up
< BACK TO ALL REPORTS

The Fear & Greed Model suggests extreme fear

Dean Christians
2023-10-31
The Fear and Greed Model, a sentiment indicator that measures investor behavior, dropped to one of the lowest levels in history, indicating extreme pessimism. Similar signals suggest a cautious outlook for the S&P 500 over the following two months.

Key points:

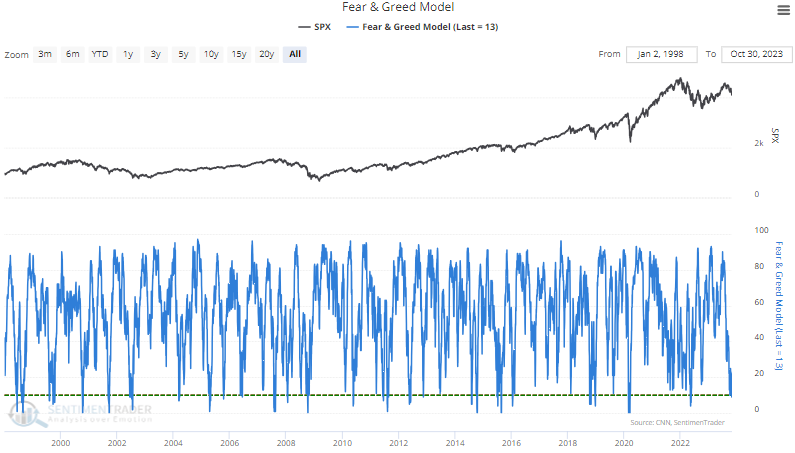
  • The Fear & Greed Model, a sentiment indicator, declined to one of the lowest levels in history
  • After similar signals, the S&P 500 struggled over the subsequent two months
  • A more favorable setup occurs after the model cycles from less than 10% to greater than 51%

Sentiment indicators work best when they reverse from an extreme

Similar to what I've shared with market breadth indicators over the last week, sentiment measures are increasingly revealing a growing sense of pessimism in an environment that already exhibits a lack of confidence in the stock market's prospects.   

One of those indicators, the Fear & Greed Model, dropped below 10% for only the 25th time since 1999, suggesting a heightened level of fear among investors. 

Similar sentiment extremes suggest the S&P 500 could struggle

Whenever the Fear & Greed Model dips below 10%, the S&P 500 encounters difficulties in the following two months. At some point over that same time frame, the large-cap index was negative in 19 out of 24 precedents.

Almost 60% of the signals occurred in a bear market or a correction that exceeded -14% from peak to trough. 

I used a reset above 50% to screen out repeats. 

Wait for the Fear & Greed Model to reverse 

I conducted a test to assess what level produced the best outlook for the S&P 500 after the Fear & Greed Model declined below 10%, like now. The study returned a reversal above 51% as the optimal threshold with a holding period of 42 trading days.

What the research tells us...

The Fear and Greed Model dropped to one of the lowest levels in history, indicating fear among traders. Such pessimistic situations tend to occur in substantial market corrections and bear markets. Therefore, it's unsurprising to see the S&P 500 struggle over the following few months, as periods of pessimism can lead to a negative feedback loop. Whether sentiment or breadth-based measures, the best risk/reward setups occur when indicators reverse from an extreme. Patience is paramount in oversold conditions exhibiting pessimism.

Sorry, you don't have access to this report

Upgrade your subscription plan to get access
Go to Dasboard
DATA &
TECHnologies
IndicatorEdge
‍
BackTestEdge
‍
Other Tools
‍
DataEdge API
RESEARCH
reports
Research Solution
‍
Reports Library
‍
actionable
Strategies
Trading Strategies
‍
Smart Stock Scanner
‍
FREE
RESOUrCES
Simple Backtest
Calculator
Simple Seasonality
Calculator
The Kelly Criterion
Calculator
Sentiment Geo Map
‍
Public Research Reports
‍
Free Webinar
COMPANY
‍
About
‍
Meet our Team
‍
In the News
‍
Testimonials
‍
Client Success Stories
Pricing
Bundle pricing
‍
Announcements
‍
FAQ
© 2024 Sundial Capital Research Inc. All rights reserved.
Setsail Marketing
TermsPrivacyAffiliate Program
Risk Disclosure: Futures and forex trading contains substantial risk and is not for every investor. An investor could potentially lose all or more than the initial investment. Risk capital is money that can be lost without jeopardizing ones’ financial security or life style. Only risk capital should be used for trading and only those with sufficient risk capital should consider trading. Past performance is not necessarily indicative of future results.

Hypothetical Performance Disclosure: Hypothetical performance results have many inherent limitations, some of which are described below. No representation is being made that any account will or is likely to achieve profits or losses similar to those shown; in fact, there are frequently sharp differences between hypothetical performance results and the actual results subsequently achieved by any particular trading program. One of the limitations of hypothetical performance results is that they are generally prepared with the benefit of hindsight. In addition, hypothetical trading does not involve financial risk, and no hypothetical trading record can completely account for the impact of financial risk of actual trading. for example, the ability to withstand losses or to adhere to a particular trading program in spite of trading losses are material points which can also adversely affect actual trading results. There are numerous other factors related to the markets in general or to the implementation of any specific trading program which cannot be fully accounted for in the preparation of hypothetical performance results and all which can adversely affect trading results.

Testimonial Disclosure: Testimonials appearing on this website may not be representative of other clients or customers and is not a guarantee of future performance or success.