
The fear gauge just gave a buy signal for stocks

Key points:
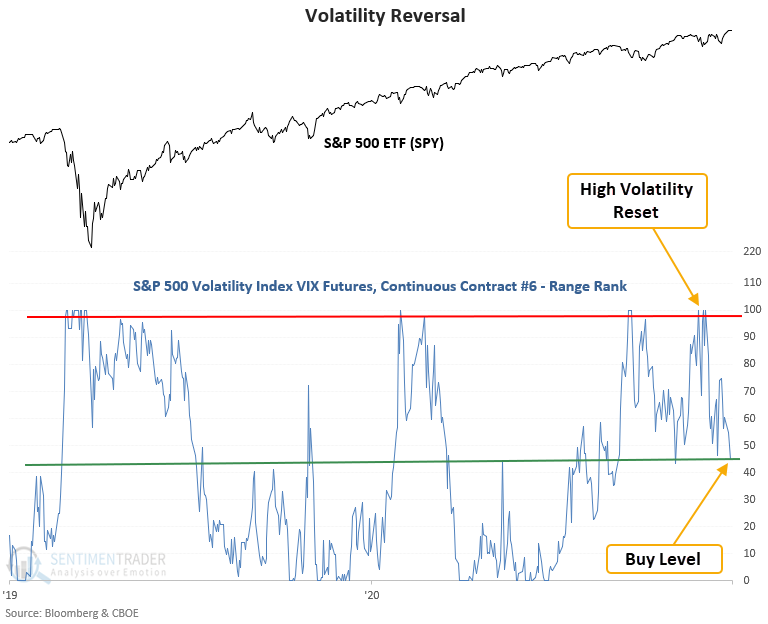
- VIX futures show that volatility cycled from high to low relative to its recent range
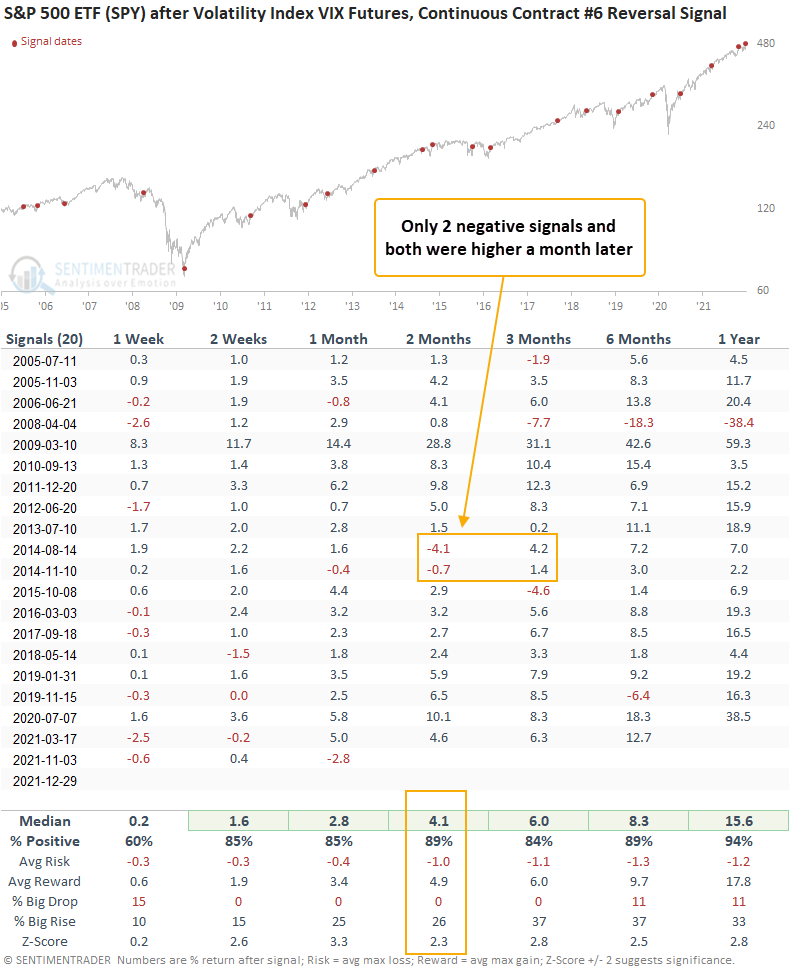
- The S&P 500 rallied 89% of the time over the next 2 months after other signals
Using the VIX as a way to measure volatility cycles
A trading model that uses VIX futures to identify when volatility cycles from high to low issued a buy signal at the close of trading on Wednesday.
The VIX Futures Range Rank signal triggers when the 4-month range rank for the VIX Futures Continuous Contract #6 reverses from a period of high volatility to low volatility. I use the 6-month continuous contract versus shorter duration contracts as the middle of the futures curve provides slightly better trading results.
The previous signal from November shows a profit through 12/29/21.
SPY rallied 89% of the time after other signals
This signal has triggered 20 other times over the past 16 years. After the others, SPY's future returns, win rates, and risk/reward profiles were solid in 6 out of 7 periods. The most recent signal from November stumbled out of the gate. However, it has now recovered to show a gain of 2.75% through the first 38 sessions.
What the research tells us...
When stocks go from a period of high to low volatility, it signals that investors have started to calm down after a panic, or at least heightened concern. Using VIX futures to measure that change in sentiment, similar setups to what we're seeing now have preceded rising SPY prices almost every time 2 months later.