Data &
Technology
Research
Reports
Report Solutions
Reports Library
Actionable
Strategies
Free
Resources
Simple Backtest Calculator
Simple Seasonality Calculator
The Kelly Criterion Calculator
Sentiment Geo Map
Public Research Reports
Free Webinar
Pricing
Company
About
Meet Our Team
In the News
Testimonials
Client Success Stories
Contact
Log inLoginSign up
< BACK TO ALL REPORTS

The equity only put call ratio triggered a new buy signal

Dean Christians
2022-03-03
The equity-only put/call ratio increased relative to its recent range and subsequently reversed lower, triggering a buy signal for stocks with a 77% win rate.

Key points:

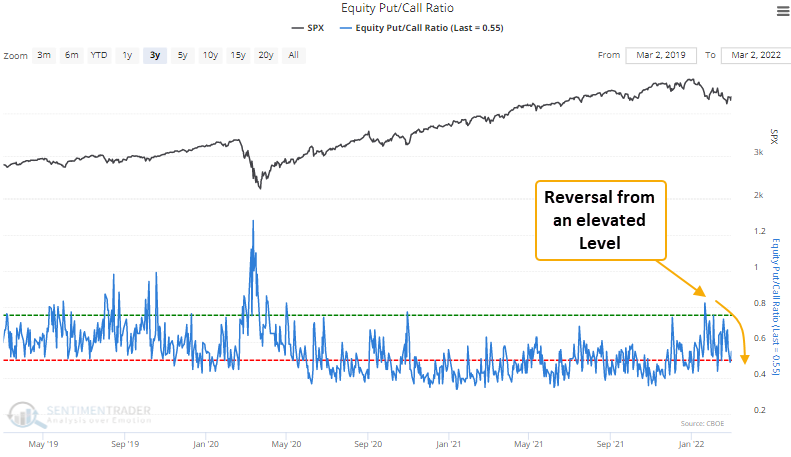
  • Equity-only put volume increased relative to call volume
  • The put/call ratio has now reversed lower from an elevated level
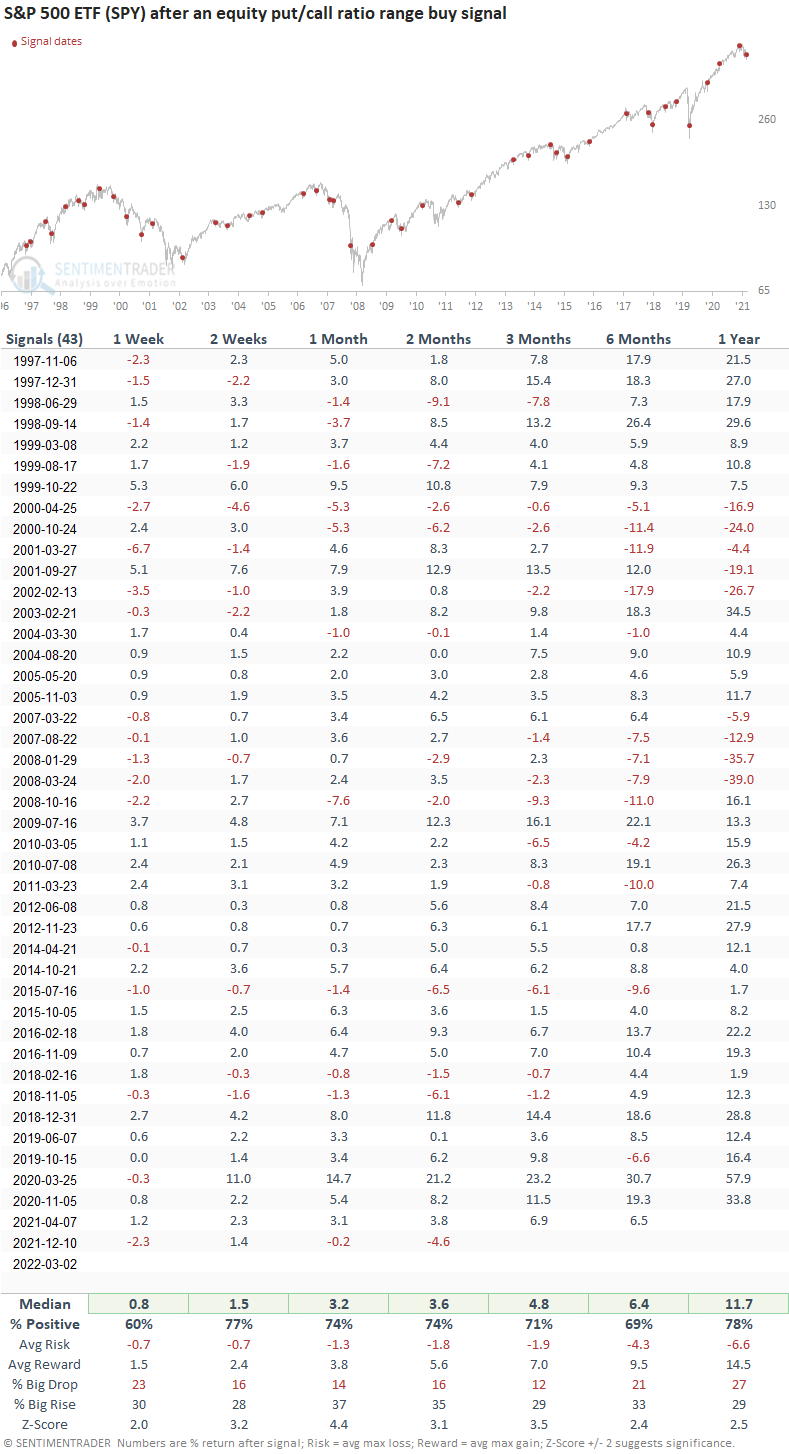
  • The S&P 500 has rallied 77% of the time after other signals

The put-call ratio as a contrary sentiment indicator

When investors are bullish on stocks, they buy call options to bet on rising prices. Conversely, when they are bearish on stocks, they purchase put options to bet on declining stocks. The equity-only put/call ratio can be used as a contrary indicator to identify an environment where sentiment has become too pessimistic on the future direction of stocks. When opinions become too bearish, stocks tend to rally.

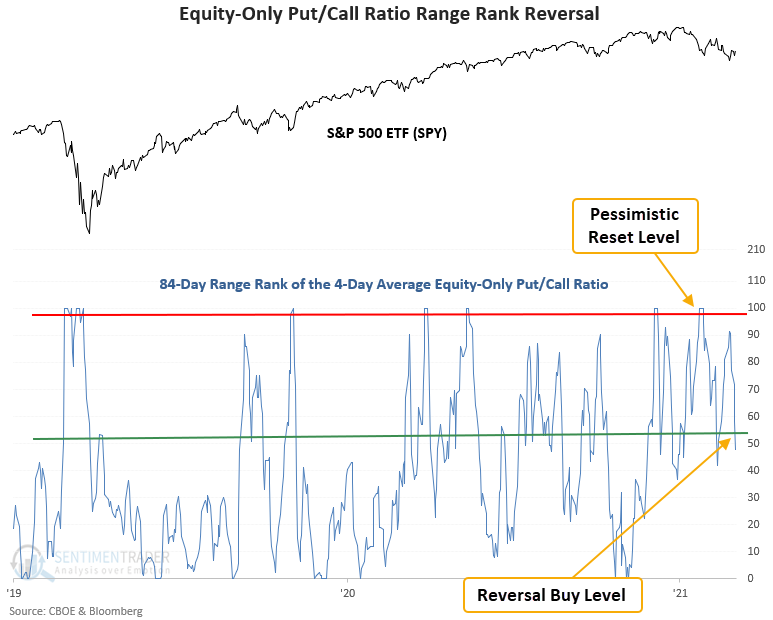
A trading model that identifies a reversal in the put/call ratio

The trading model applies an 84-day range rank to the 4-day moving average of the CBOE equity-only put/call ratio. The pessimistic reset condition is confirmed when the range rank indicator crosses the 99th percentile. A new buy signal occurs when the range rank crosses below the 54th percentile. Within 5 days of the cross, the 5-day rate of change for the S&P 500 must be >= 3%. i.e., market momentum is positive.

The signal did not trigger when the range rank crossed below the threshold level in February because the momentum condition was invalid.

Similar reversals in the put/call ratio have preceded gains 77% of the time

This signal triggered 43 other times over the past 25 years. After the others, S&P future returns, win rates, and risk/reward profiles were excellent across all time frames. The signal shows positive performance at some point in the first month in 41 out of 43 instances. And, the max drawdown of 7.6% occurred within the depths of the global financial crisis.

What the research tells us...

When equity-only put volume increases relative to call volume, traders have become too pessimistic on the outlook for stocks. Stocks are likely to trade higher when the pessimistic extreme reverses. Similar setups to what we're seeing now have preceded rising prices for the S&P 500 ETF (SPY), with a 2-week win rate of 77%. Drawdowns were relatively benign, even in nasty bear markets.

I've shared several sentiment-based buy signals since the correction started in January. The energy ones have worked well. However, most broad market signals have shown a tepid response. I continue to believe that a better risk/reward outlook for the overall market will come when we see panic buying that lifts all stocks.

DATA &
TECHnologies
IndicatorEdge
‍
BackTestEdge
‍
Other Tools
‍
DataEdge API
RESEARCH
reports
Research Solution
‍
Reports Library
‍
actionable
Strategies
Trading Strategies
‍
Smart Stock Scanner
‍
FREE
RESOUrCES
Simple Backtest
Calculator
Simple Seasonality
Calculator
The Kelly Criterion
Calculator
Sentiment Geo Map
‍
Public Research Reports
‍
Free Webinar
COMPANY
‍
About
‍
Meet our Team
‍
In the News
‍
Testimonials
‍
Client Success Stories
Pricing
Bundle pricing
‍
Announcements
‍
FAQ
© 2024 Sundial Capital Research Inc. All rights reserved.
Setsail Marketing
TermsPrivacyAffiliate Program
Risk Disclosure: Futures and forex trading contains substantial risk and is not for every investor. An investor could potentially lose all or more than the initial investment. Risk capital is money that can be lost without jeopardizing ones’ financial security or life style. Only risk capital should be used for trading and only those with sufficient risk capital should consider trading. Past performance is not necessarily indicative of future results.

Hypothetical Performance Disclosure: Hypothetical performance results have many inherent limitations, some of which are described below. No representation is being made that any account will or is likely to achieve profits or losses similar to those shown; in fact, there are frequently sharp differences between hypothetical performance results and the actual results subsequently achieved by any particular trading program. One of the limitations of hypothetical performance results is that they are generally prepared with the benefit of hindsight. In addition, hypothetical trading does not involve financial risk, and no hypothetical trading record can completely account for the impact of financial risk of actual trading. for example, the ability to withstand losses or to adhere to a particular trading program in spite of trading losses are material points which can also adversely affect actual trading results. There are numerous other factors related to the markets in general or to the implementation of any specific trading program which cannot be fully accounted for in the preparation of hypothetical performance results and all which can adversely affect trading results.

Testimonial Disclosure: Testimonials appearing on this website may not be representative of other clients or customers and is not a guarantee of future performance or success.