Data &
Technology
Research
Reports
Report Solutions
Reports Library
Actionable
Strategies
Free
Resources
Simple Backtest Calculator
Simple Seasonality Calculator
The Kelly Criterion Calculator
Sentiment Geo Map
Public Research Reports
Free Webinar
Pricing
Company
About
Meet Our Team
In the News
Testimonials
Client Success Stories
Contact
Log inLoginSign up
< BACK TO ALL REPORTS

The Energy Sector's Panic Breadth Reversal

Jason Goepfert
2021-09-29
Energy stocks saw an internal breadth panic in mid-August. Since then, they've recovered strongly and a composite breadth measure completely reversed course. Now the sector has something to prove if it's going to continue in a bull market environment.

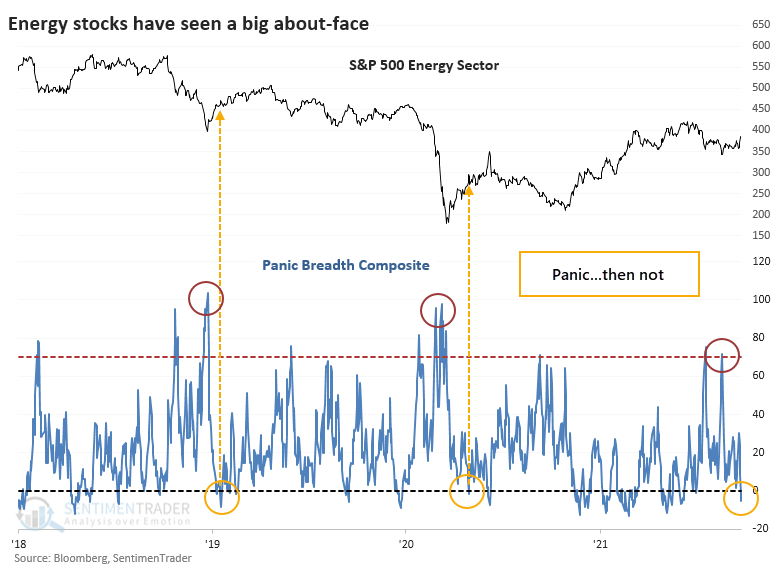
Like we saw with the Hang Seng and Industrials, Energy stocks have seen something of a panic. But unlike the other two, these stocks have also seen a quick about-face.

Using the same concept as the other two, and computing a composite breadth measure that aggregates nine different breadth metrics to detect hints of panic, Energy stocks suffered a panic spike in mid-August. But within a 30-day window, the panic completely reversed and went into negative territory. It's been relatively rare to see "negative panic" in recent years.

There have been two recent times when the Panic Breadth Composite reversed from above 70% to below zero within 30 days, in January 2019 and April 2020. Volatility was extremely high following the initial pandemic rebound but the sector did work higher both times for a couple of months before giving back those gains.

A LONG-TERM LOOK AT PANIC REVERSALS

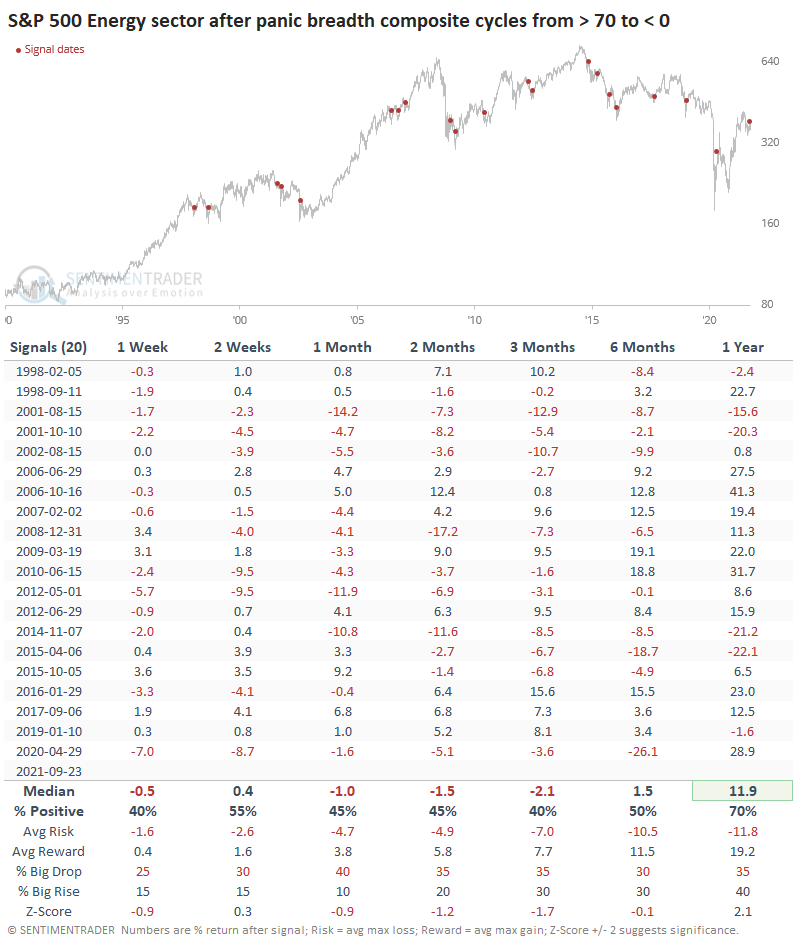
Other times when investors in Energy stocks panicked by selling almost everything and then did a complete about-face, the sector tended to struggle in the months ahead. Over the next three months, only 40% of the signals saw the sector trade higher. The risk/reward was poor, and there was more of a tendency to see a big drop than a big rise.

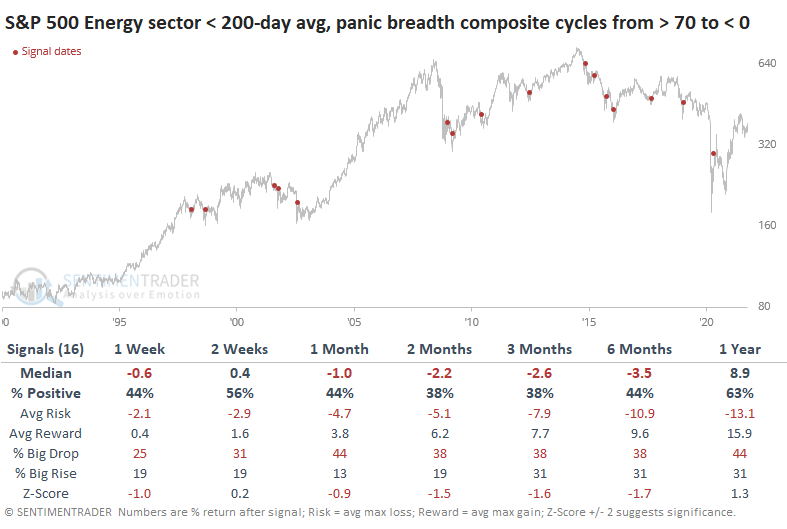
Volatility tends to be higher during bear markets, and the overwhelming majority of signals occurred when the S&P 500 Energy sector was below its 200-day moving average. Out of 20 breath reversals, 16 of them triggered during bear markets. And so it makes sense that rallies during bear markets tended to see below-average returns going forward.

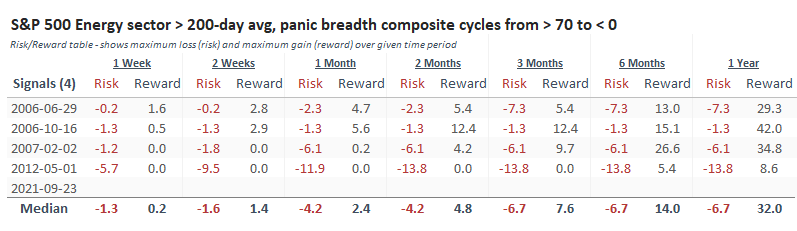
PANIC REVERSALS IN BULL MARKETS

There were only four other times it triggered when above the 200-day, like it did this time. The success rate was higher (as much as we can read into a sample size of four), but not without volatility. Over the next year, Energy stocks rallied each time, but three of the four instances were clustered in an 8-month window.

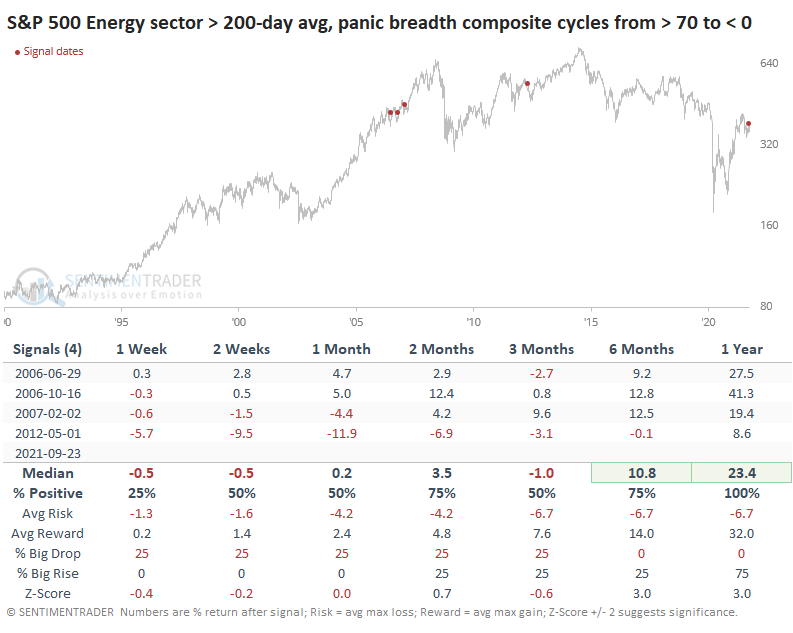
The Risk/Reward Table shows quite a bit of risk among the four. Three of them suffered more than a 5% loss at some point during the next few months, and one was more than 10%.

With signals like this, losers tend to start losing right away as sellers see their first real opportunity to get out at a good price. While that can happen with winning signals, too, the selling tends to be milder and briefer. Overbought conditions are seen as less of a barrier and perhaps even a sign of unusual and persistent strength, which attracts even more buyers. The sector has a lot to prove, and this will be a good test. If the stocks can hold together in the weeks ahead, this reversal in panic should prove to be a lasting sign of a change in character.

Sorry, you don't have access to this report

Upgrade your subscription plan to get access
Go to Dasboard
DATA &
TECHnologies
IndicatorEdge
‍
BackTestEdge
‍
Other Tools
‍
DataEdge API
RESEARCH
reports
Research Solution
‍
Reports Library
‍
actionable
Strategies
Trading Strategies
‍
Smart Stock Scanner
‍
FREE
RESOUrCES
Simple Backtest
Calculator
Simple Seasonality
Calculator
The Kelly Criterion
Calculator
Sentiment Geo Map
‍
Public Research Reports
‍
Free Webinar
COMPANY
‍
About
‍
Meet our Team
‍
In the News
‍
Testimonials
‍
Client Success Stories
Pricing
Bundle pricing
‍
Announcements
‍
FAQ
© 2024 Sundial Capital Research Inc. All rights reserved.
Setsail Marketing
TermsPrivacyAffiliate Program
Risk Disclosure: Futures and forex trading contains substantial risk and is not for every investor. An investor could potentially lose all or more than the initial investment. Risk capital is money that can be lost without jeopardizing ones’ financial security or life style. Only risk capital should be used for trading and only those with sufficient risk capital should consider trading. Past performance is not necessarily indicative of future results.

Hypothetical Performance Disclosure: Hypothetical performance results have many inherent limitations, some of which are described below. No representation is being made that any account will or is likely to achieve profits or losses similar to those shown; in fact, there are frequently sharp differences between hypothetical performance results and the actual results subsequently achieved by any particular trading program. One of the limitations of hypothetical performance results is that they are generally prepared with the benefit of hindsight. In addition, hypothetical trading does not involve financial risk, and no hypothetical trading record can completely account for the impact of financial risk of actual trading. for example, the ability to withstand losses or to adhere to a particular trading program in spite of trading losses are material points which can also adversely affect actual trading results. There are numerous other factors related to the markets in general or to the implementation of any specific trading program which cannot be fully accounted for in the preparation of hypothetical performance results and all which can adversely affect trading results.

Testimonial Disclosure: Testimonials appearing on this website may not be representative of other clients or customers and is not a guarantee of future performance or success.