
The Dow in Post-Election July

With July inbound, I wanted to highlight the stock market's historical performance during July of the Post-Presidential Election years.
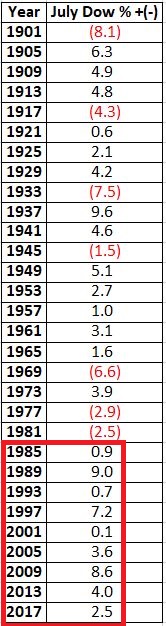
The table below displays the % +(-) price change for July during each Post-Presidential Election year starting in 1901.
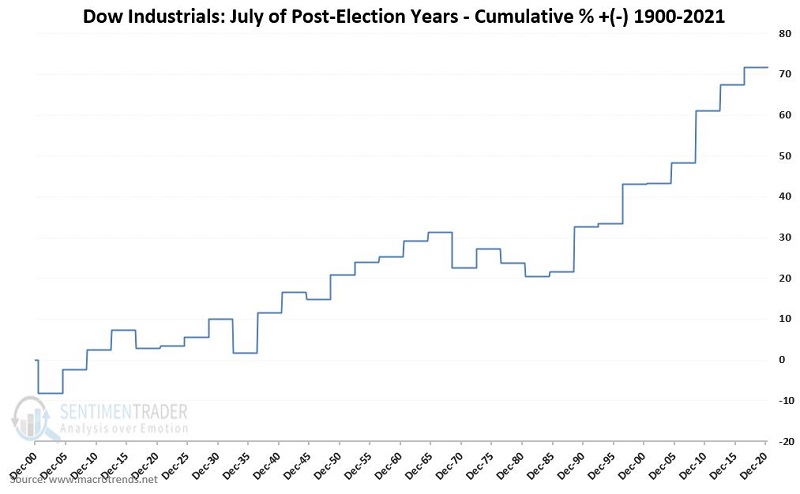
The chart below displays the cumulative % +(-) (price only) for the Dow ONLY during July of the Post-Election years since 1901.
The table below presents a summary of the results.
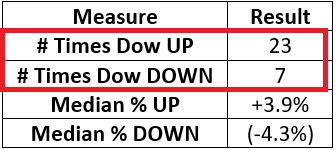
For the record:
- The month of July in a Post-Election year has not seen a Dow decline since 1981
- The last 9 Post-Election July's have seen the Dow advance a median +3.6%.
So, what happens in 2021? Is Post-Election July "on a roll"? Or is it due for an off-year?
Ah, there's the rub. As always, the catch with any seasonal trend is that there is never any guarantee that it will work "this time around."
Still, if the market closes higher for June, the prospects for a bullish continuation may improve.