
The dollar's trend seems to be turning, but...

Many markets seem to be keying off each other in recent weeks, with some version of a move in rates driving the dollar which drives gold and tech stocks which drives the broader market.
It's interesting how trends and streaks in one market closely are closely overlapping those in others. For example, the S&P 500 just slid below its 50-day moving average for the first time in months and then on Tuesday the U.S. dollar just rose above its own 50-day for the first time since May.
That ended a streak of 90 sessions that the dollar had been below its medium-term average, ranking among the longest streaks since 1975.
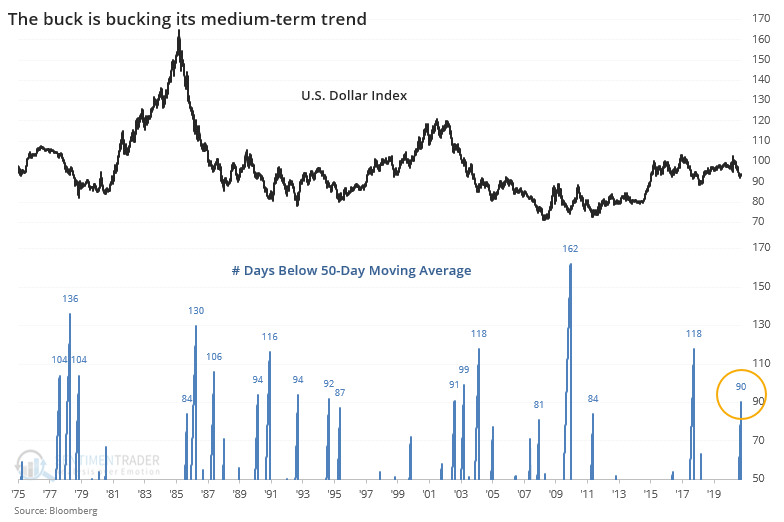
It's been hard for the dollar to hold any kind of positive momentum when sentiment toward the currency is poor. Other times it broke a long streak below its 50-day average while still being below its 200-day average, it preceded poor returns. Out of the 19 signals, 16 of them saw a negative return at some point during the next 1 - 3 months.
This is an abridged version of our recent reports and notes. For immediate access with no obligation, sign up for a 30-day free trial now.
We also looked at:
- All signals showing when the dollar broke a streak below its 50-day average
- What happens when "smart money" hedgers are extremely net long the dollar
- The dollar's seasonal trend turns positive right about now
- Optimism on the dollar has been below 40 for nearly the longest time in 30 years
- Most gold mining stocks have entered a correction - what that's meant historically