
The Curious Case Of Ebbing Momentum

No mo’ mo-mo?
Even as the S&P 500 index trades at a fresh 100-day high, the ratio of the S&P 500 Momentum Index to the S&P itself is struggling, and just hit a 30-day low.
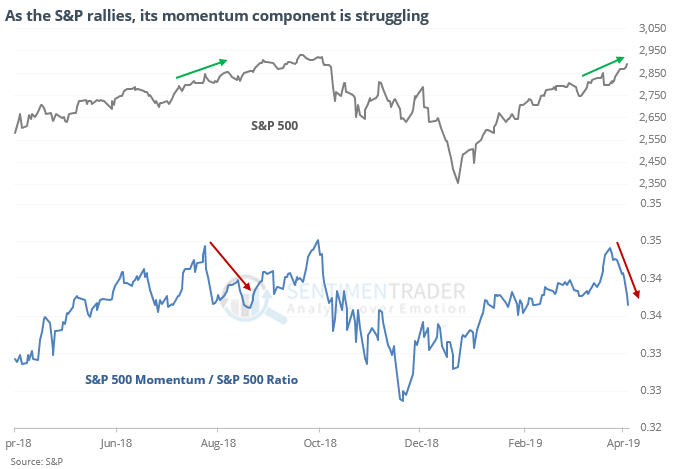
This divergence is like what happened last August. Longer-term, failing momentum wasn’t a consistent negative, but three of the last four signals did lead to a decline in stocks.
A quality 70 days
Some momentum stocks might be faltering, but the price behavior of the major indexes has been pristine. The most benchmarked index in the world has now gone 70 days from its low, and based on similar rallies, it’s due to hit a new high any day now.
It’s also been a good sign when the index has suffered so few 1% down days, and so many gaps up at the opening of trading.
The latest Commitments of Traders report was released, covering positions through Tuesday
The 3-Year Min/Max Screen shows a few new extremes this week, with hedgers establishing multi-year extreme shorts in cattle, 5-year Treasuries, and hogs. In most other contracts, they made only minor adjustments, including in stock index futures.
A new trend
The MSCI Mexico Index closed above its 200-days for the first time in six months on Friday. Other times it went this long before ending a downtrend, it added to gains over the next month 5 out of 6 times averaging 4.6% (the sole loser was -0.7%).
This post was an abridged version of our previous day's Daily Report. For full access, sign up for a 30-day free trial now.