
The Copper/Gold Ratio offer surprising clues for a variety of markets

Key points
- Gold is the most prominent precious metal, and copper is widely considered the most important industrial metal
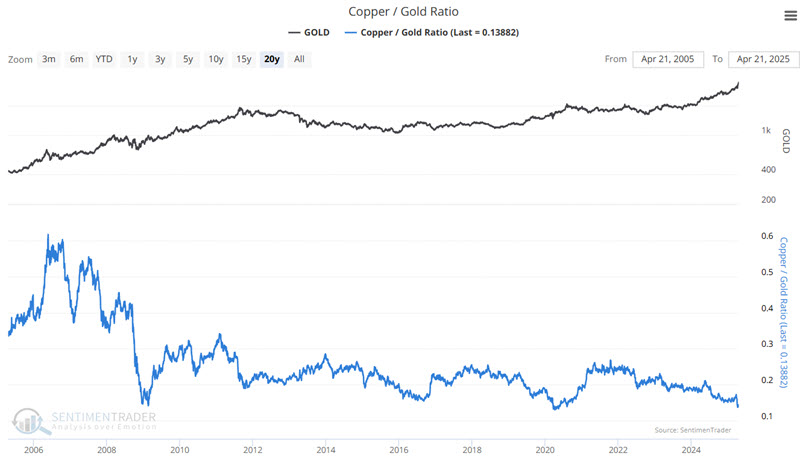
- The Copper / Gold Ratio tracks the difference in performance between copper and gold futures
- The ratio has plunged to a near all-time low at 0.13882
- Does this have any significant implications for copper and gold or other markets? The results may surprise you
The overview
The Copper / Gold Ratio was popularized by Jeffrey Gundlach, CEO of DoubleLine Capital LP. Note: Our calculation uses Copper and Gold Continuous Futures contracts.
The results we will display below are fairly compelling. However, before getting into the data, we need to point out a variety of caveats.
- The measures and results detailed below are not intended to be used as a standalone trading or market timing method
- The sample sizes for some of the more extreme readings may be relatively small
- There is no inference being made that future performance will resemble past results
- Some of the more recent signals are significantly "under water" at the moment.
- With all those caveats in mind, let's look at historical market performance for various markets based on the status of the Copper / Gold Ratio (CGR).
For testing, we will look at the following markets or indexes:
- S&P 500 Index (SPX)
- iShares 20+ Year Treasury Bond ETF (TLT)
- Bloomberg Commodity Spot Price Index (BCOMSP)
- US Dollar
- Gold
- Copper
- Crude Oil
- Unleaded Gas
For our tests, we will:
- Compare performance when the ratio is above 0.18 versus below 0.18
- Compare performance when the ratio is above 0.155 versus below 0.155
- Examine performance after the ratio rises above 0.155 for the first time in three months
Copper / Gold Ratio reading above 0.18 versus below 0.18
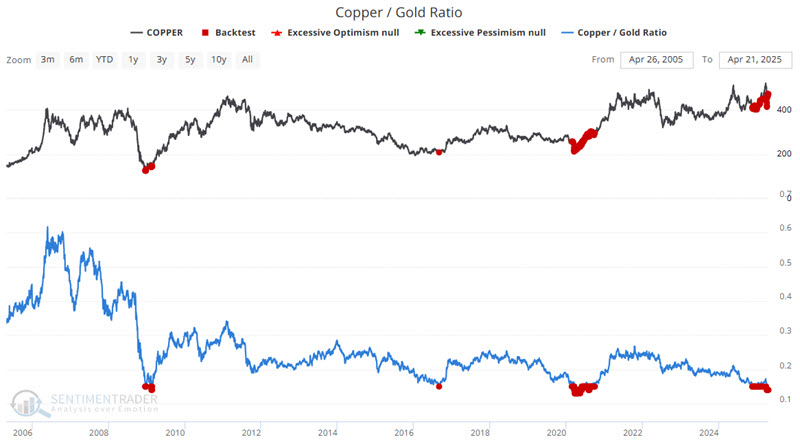
The chart below features copper and highlights all dates when the CGR was below 0.18. The table summarizes copper's performance in the following year.
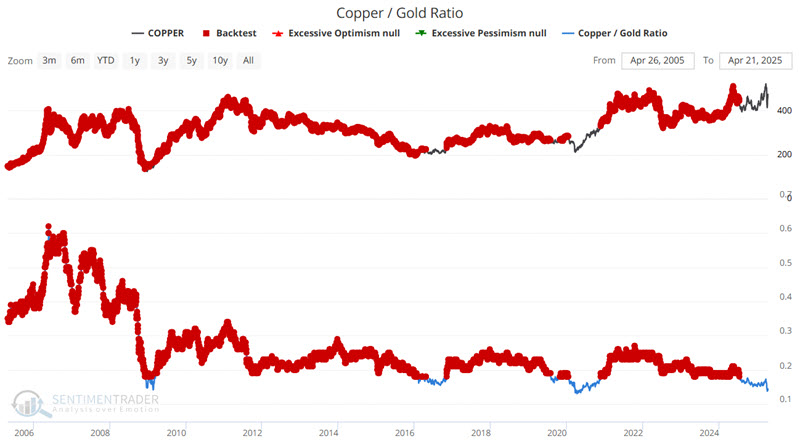
In contrast, the chart below features copper and highlights all dates when the CGR was above 0.18, and the table summarizes copper performance in the following year.
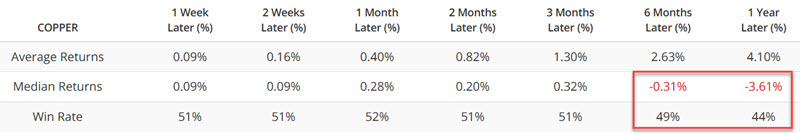
Key things to note:
- The sample size is relatively small, as the CGR has not spent much time below 0.18.
- The difference in copper performance based on CGR readings being above or below 0.18 is stark
Now let's consider the other markets in our test. The table below summarizes 12-month results for:
- Win Rates
- Median 12-month % return
- The difference between performance when CGR is above or below 0.18
The table below summarizes performance over the last twenty years for each market listed above, dividing results by whether the Copper/Gold Ratio was above or below 0.18.
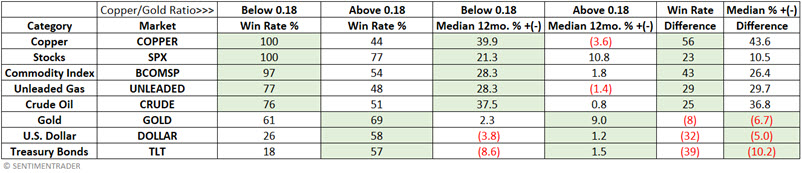
We see that copper, stocks, commodities, unleaded gas, and crude oil performed significantly better on average in the year after any CGR reading below 0.18. Conversely, performance for the US Dollar and long-term US treasuries has been notably worse following CGR readings below 0.18.
Interestingly, overall gold performance has been slightly worse when CGR is below 0.18, though that has obviously not been the case since CGR last fell below 0.18 in July 2024. Since then, gold has advanced 39%. During the same time, copper has advanced roughly 7.5%. This massive gold outperformance differs from what we have seen during previous "CGR below 0.18" periods.
So, does this imply that we should look for copper to start outperforming gold very soon? We cannot predict (remember, we report, you decide) how things will ultimately play out this time. However, the results above imply that the current state of affairs (soaring gold accompanied by languishing copper) will likely not last forever.
Copper / Gold Ratio reading above 0.155 versus below 0.155
If you thought the sample size above was small, let's narrow down to an even more extreme test and look at performance following CGR readings above or below 0.15.
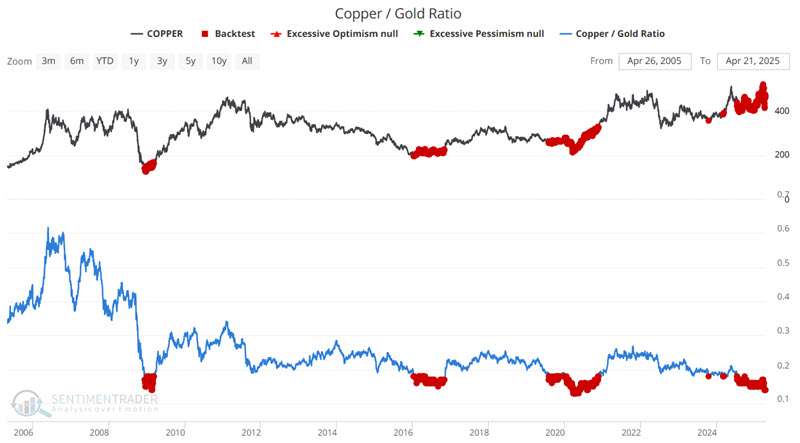
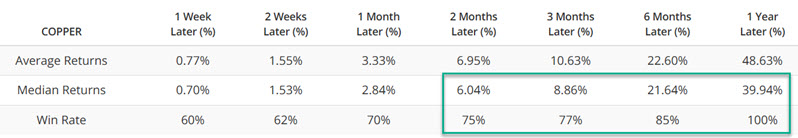
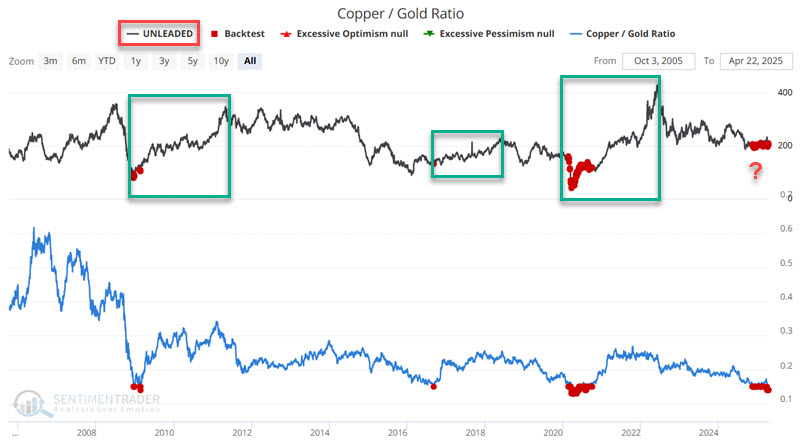
The chart below features copper and highlights all dates when the CGR was below 0.15. The table summarizes copper's performance in the following year.
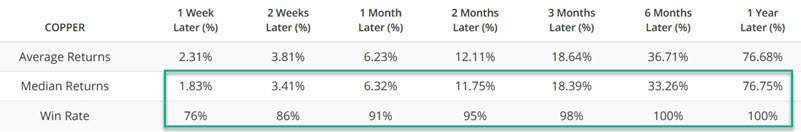
Does the table above tell us that copper is 100% sure to rise over 70% in the year ahead? Unfortunately, that's not how it works. As always, past performance is no guarantee of future results. Likewise, the exceedingly small sample size warns us to look for other confirmation and not to rely too heavily on this one indicator. That said, at the very least, traders are encouraged to watch closely for any real "signs of life" in the copper market.
Now let's consider the other markets in our test. The table below summarizes 12-month results for:
- Win Rates
- Median 12-month % return
- The difference between performance when CGR is above or below 0.155
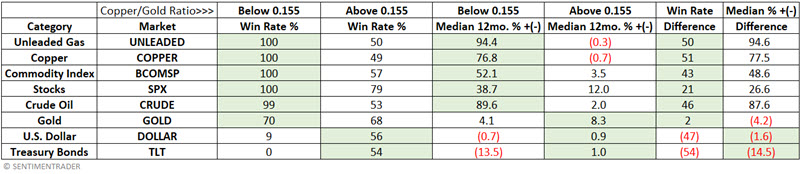
Here again, we see some surprisingly stark differences in performance. Following CGR readings below 0.155, Unleaded Gas has shown a 100% Win Rate and a 94.4% Median 12-month return.
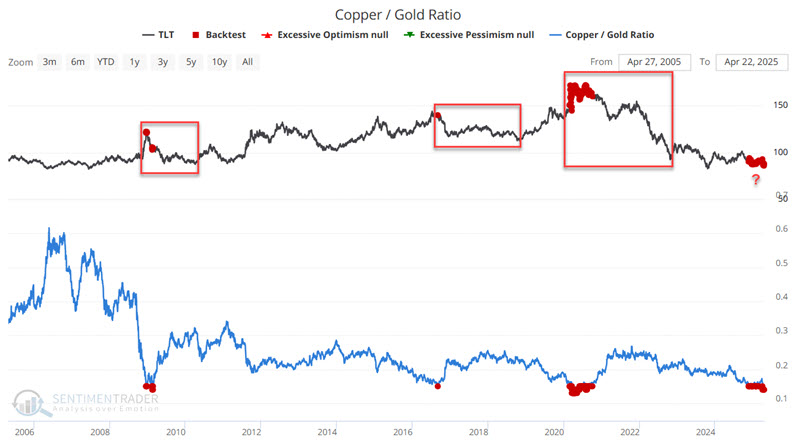
Conversely, following CGR readings below 0.155, ticker TLT has shown a 0% Win Rate and -13.5% Median 12-month return.
IMPORTANT NOTE: Remember, no trading positions should be established based solely on this information. These are data points for consideration and not trading signals.
Copper / Gold Ratio crosses above 0.155
The CGR is presently well below our arbitrary test point of 0.155 (at 0.13882). At some point, the CGR will cross back above 0.155. Should we pay attention? The table below summarizes performance for our test markets during the 12 months after the CGR crossed above 0.155 for the first time in three months.
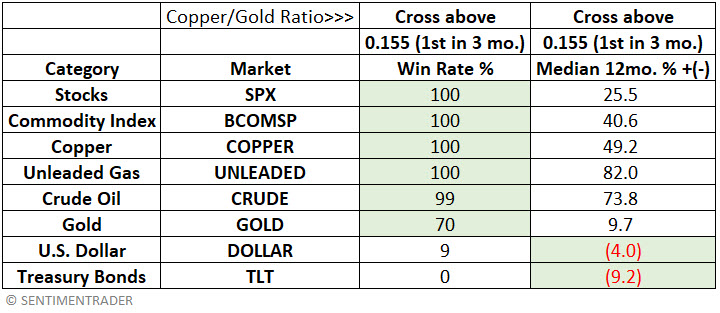
Historically (again, note the small sample size and take it with a grain of salt), stocks, commodities, copper, unleaded gas, and crude oil have performed well. Conversely, the US Dollar and long-term US treasuries have suffered. Interestingly, gold's performance has paled compared to some other listed markets.
What the research tells us…
What does the research tell us? It pains me to say it, but the answer could be "not much." The small sample size and limited data set remind us that the results above should not be relied upon solely as a reason to make any trade, bullish or bearish. That said, much of trading success is based on combining the weight of the evidence and deciding which way the probabilities lie. Some of the markets that have done well in the past during low CGR periods have taken a beating lately (stocks, crude, unleaded). Does that mean an opportunity is forming? Or is the CGR just an irrelevant factor this time around? That is a question for each trader to answer on their own. Still, watching for a CGR cross back above 0.155 might be a worthwhile item to add to the radar.