
The Copper/Gold Ratio as an Economic Indicator

Many analysts like to infer that changes in the price of copper have some sort of mystical forecasting capabilities. Many refer to it as "Dr. Copper," based on these supposed abilities. Is there anything to all of this? Well, I know of at least one way to use changes in the price of copper to assess the likelihood of an economic recession unfolding soon.
Let's take a closer look.
THE COPPER/GOLD RATIO TREND INDICATOR (CGTI)
We start with some elementary calculations, done once a month at the end of each month.
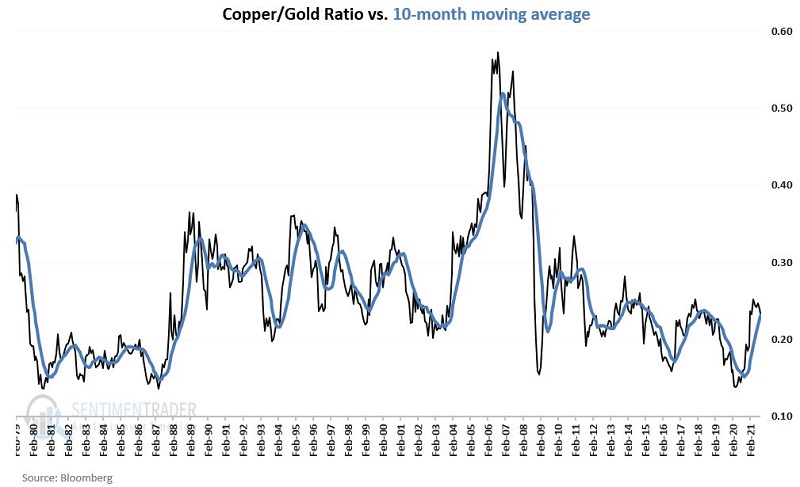
- A = Copper month-end price
- B = Gold month-end price
- C = A / B
- D = 10-month simple moving average of C
- E = C - D
In sum, Variable E is the latest month-end copper/gold ratio minus the 10-month moving average of month-end copper/gold ratio readings. From here on we will refer to Variable E as the Copper/Gold Trend Indicator (or CGTI for short).
The chart below displays Variables C and D above.
 The chart below subtracts D from C and displays the difference between the two variables (i.e., CGTI).
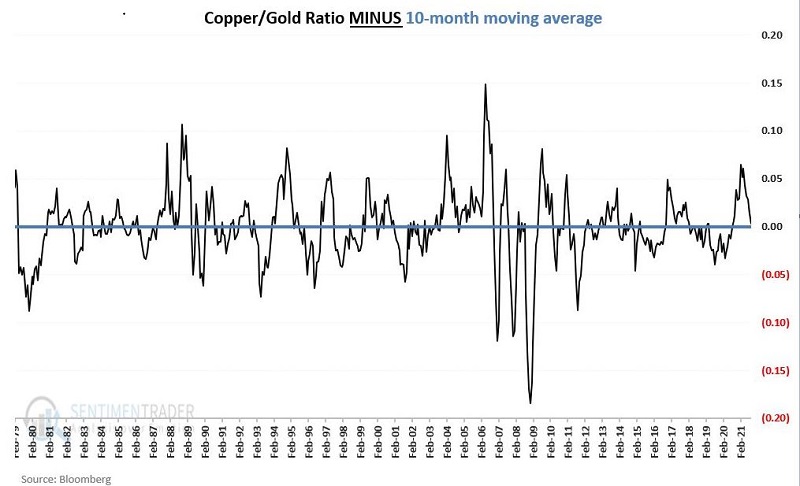 If the underlying theory contemplated above is correct, then:
- Higher readings should be "Favorable" for the economy
- Lower readings should be "Unfavorable" for the economy
MEASURING ECONOMIC TRENDS
As a measure of "the economy," we will use the Coincident Economic Activity Index (or CEI, which can be found here). We will use the latest available CEI data as of the last day of the month for testing. For example, on 9/28, the CEI data for August was reported. We use that data as the "month-end" data for September 2021.
The chart below displays a chart for this data series since available in the late 1970s.
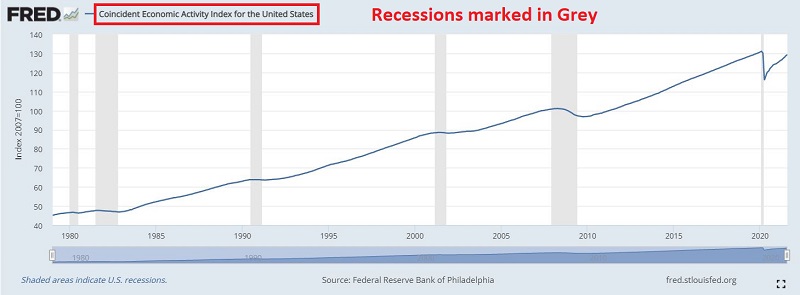 Note in the chart above:
- This series typically trends higher (88.4% of all months showed a rise in CEI)
- Economic recessions (which are defined as periods when the CEI declines) are shaded in grey
TESTING FAVORABLE READINGS FOR CGTI
The goal here is NOT "to pinpoint tops and bottoms in the economy with pinpoint accuracy" (well, actually, that's an excellent goal - just not a very realistic one).
At the end of each month, the goal is to assess whether or not we need to worry about a recession beginning in the month - or months - ahead. To do this, we will look at whether CGTI is above or below a particular cutoff level.
- We will use 0.018 as our "cutoff" level between "Favorable" and "Unfavorable"
To be clear, if the latest copper/gold ratio is:
- More than 0.018 points ABOVE its own 10-month average, the reading is deemed "Favorable" for the economy
- Less than or equal to 0.018 points ABOVE its own 10-month average, the reading is deemed "Unfavorable" for the economy
For our first test, we will:
- Look at the 1-month % change in the Coincident Economic Indicator Index
- ONLY following months where Variable E ended the previous month ABOVE 0.018
The results appear in chart form below.
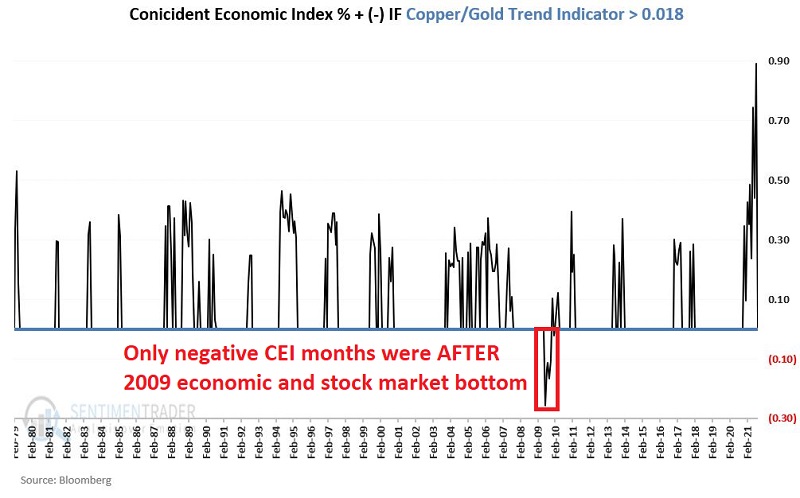
Key things to note regarding "Favorable" months:
- 122 months have seen CGTI > 0.018
- 116 times CEI rose in the next month
- 6 times CEI declined in the next month
- ALL 6 of these declining months occurred in late 2009 AFTER the economy and the stock market had bottomed
The Bottom Line: 95.1% of the time, CEI rose (or remained unchanged) in the month following a CGTI reading of 0.018 or higher at the end of the previous month.
The Bottom Line in Plain English: If the CGTI > 0.018 at the end of this month, the odds of a recession beginning (or continuing) in the next month is (historically speaking) less than 5%.
The "Practical" Bottom Line: Following a CGTI > 0.018 reading, ignore any news you read or hear about "trouble brewing in the economy" during the next month.
TESTING UNFAVORABLE READINGS FOR THE CGTI
- We will look at performance following CGTI readings of 0.018 or lower
For our first test, we will look at the 1-month % change in the Coincident Economic Indicator Index ONLY following months where Variable E ended the previous month AT OR BELOW 0.018. The results appear in chart form below.
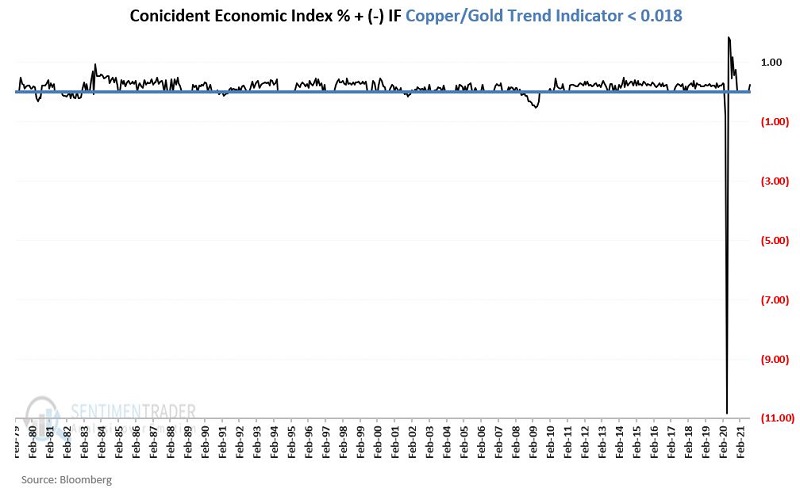
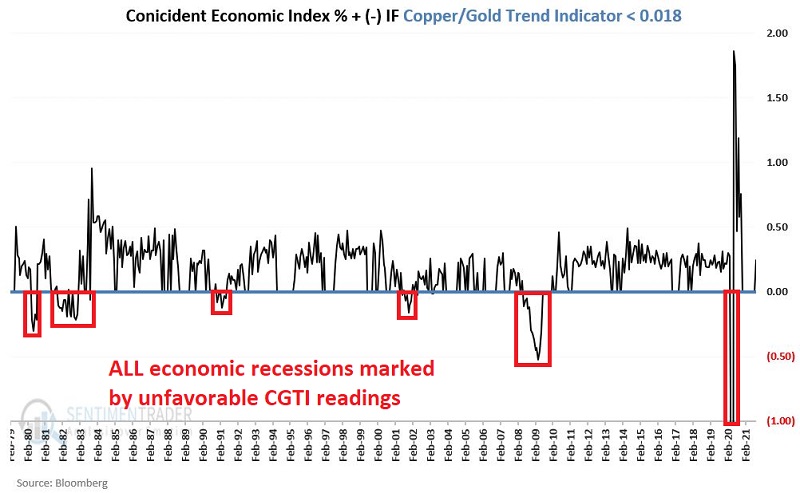
Most of the readings in the chart above are "squeezed" by the extreme Covid related reading of -10.83 in May of 2020. So, to make things more "readable," in the chart below, we cut off the lower value at -1.
Key things to note:
- 389 months have seen CGTI <= 0.018
- 341 times CEI rose in the next month
- 48 times CEI declined in the next month
- i.e., CEI rose 87.7% of the time and fell 12.3% of the time
But most importantly, note the following:
- In sum, there have been only 54 months since 1979 that saw CEI decline month-to-month
- 48 of those months - or 89% of all CEI declines - occurred when the CGTI was <= 0.018
The bottom line:
- There is no guarantee that CEI will decline if the CGTI is at 0.018 or lower
- HOWEVER, the odds of a recession occurring are significantly higher when the indicator is "Unfavorable"
THE LATEST
The chart below displays:
- Monthly readings for CGTI (blue line)
- The cutoff value of 0.018 (orange line)
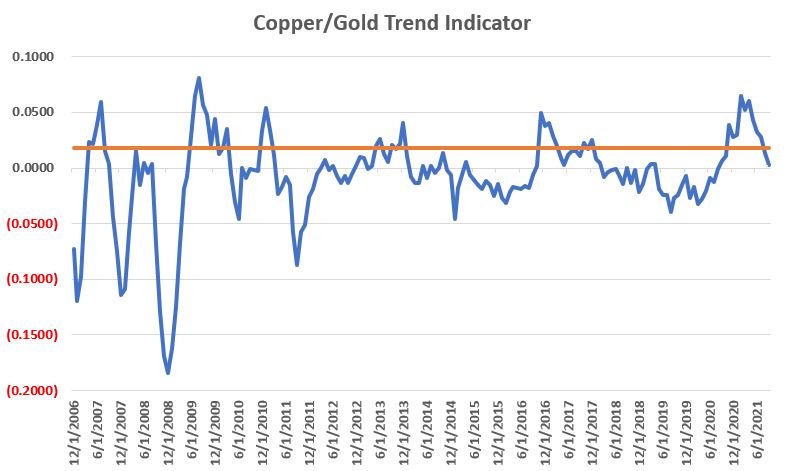 CGTI was "Favorable" from the end of November 2020 through the end of August 2021. As you can see in the chart above, it has been trending lower in recent months and is now back in "Unfavorable" territory below 0.018.
At the end of September 2021:
- The copper/gold ratio stood at 0.2336
- The 10-month moving average stood at 0.2307
- The CGTI stood at 0.0029 (0.2336-0.2307)
Since the latest reading is below our cutoff value of 0.018, does this mean that a recession is imminent? Not at all! Remember that declines in CEI are the exception to the rule. The main takeaway from the current reading is that the threat of an economic downturn is now higher than it was when CGTI stood above 0.018.