Data &
Technology
Research
Reports
Report Solutions
Reports Library
Actionable
Strategies
Free
Resources
Simple Backtest Calculator
Simple Seasonality Calculator
The Kelly Criterion Calculator
Sentiment Geo Map
Public Research Reports
Free Webinar
Pricing
Company
About
Meet Our Team
In the News
Testimonials
Client Success Stories
Contact
Log inLoginSign up
< BACK TO ALL REPORTS

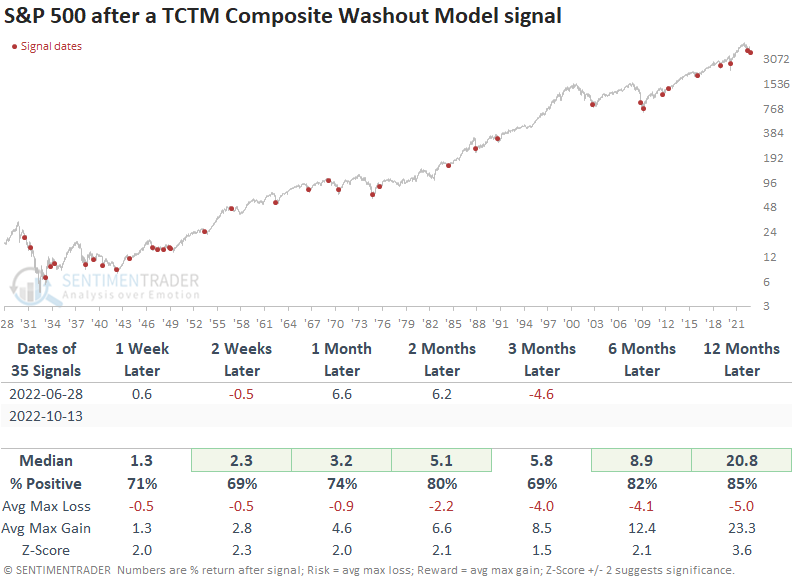
The Composite Washout Model triggers a new alert

Dean Christians
2022-10-14
For only the 36th time since 1930, the Composite Washout Model triggered a new alert. After similar signals, the S&P 500 had a favorable outlook over the next few months.

Key points:

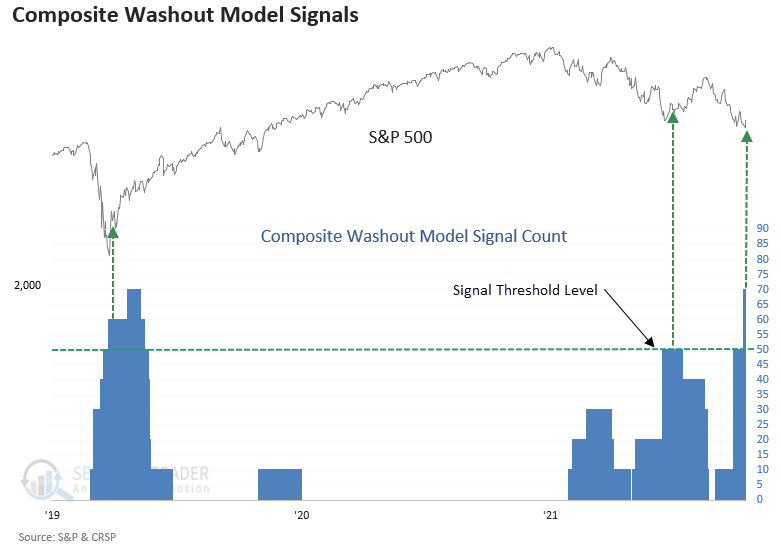
  • The TCTM Composite Washout Model exceeded the signal threshold level on September 27
  • Market momentum turned positive on October 13, triggering a new alert  
  • The S&P 500 rallied 80% of the time over the next two months after other signals
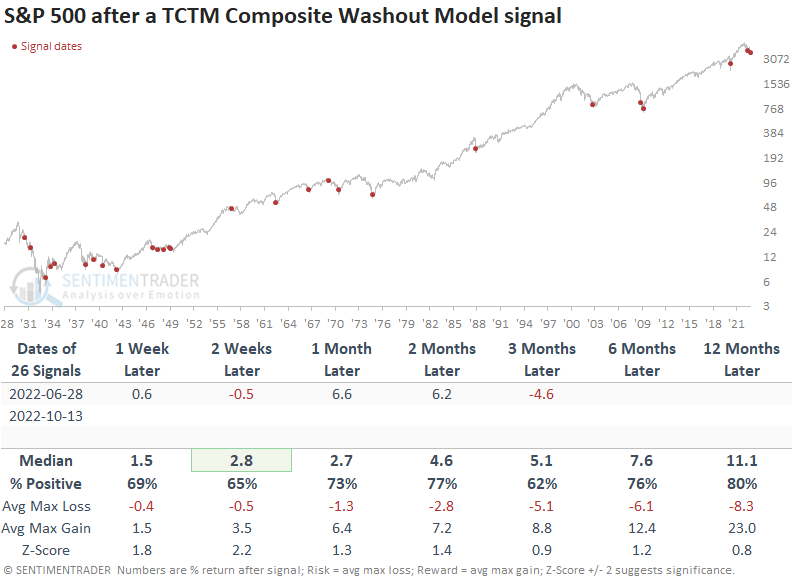
  • Signals associated with a bear market rallied 77% of the time over the next two months

The Composite Washout Model - A weight of the evidence approach

For only the 36th time since 1930, the Composite Washout Model triggered a new alert when the 10-day rate of change for the S&P 500 turned positive on Thursday. 

The previous alert occurred in June, leading to a 13% rally when measured from the publish date to the August peak in the S&P 500. 

As a reminder, I created the Composite Washout Model to identify potential turning points in drawdown phases. What a trader or investor does with the market message depends on one's investment approach and risk tolerance. 

Washout signals preceded positive returns

Washout signals show a consistent upward bias in returns across all time frames with solid win rates and z-scores. The alert shows a gain at some point in the first two months in 31 out of 35 instances. And the max drawdown across that time frame was -12.2%, which occurred in 1931.

Signals associated with a bear market 

Bear market signals show an upward return bias, with solid win rates and z-scores. However, the outlook is slightly less favorable than all signals, which is not surprising given the higher levels of volatility associated with significant market drawdowns. Once again, consistency still looks good, with 23 out of 26 winners at some point in the first two months.

What the research tells us...

Besides a handful of short-lived rallies, stocks have come under significant duress since the August peak in the S&P 500. The selling pressure has been severe enough to trigger an alert for 70% of the components in the TCTM Composite Washout Model. With price momentum turning positive on Thursday, the composite issued a counter-trend buy signal. While the outlook for a bounce looks favorable, we must remember the long-term trend for the S&P 500 is negative, and a recession seems more likely. 

Sorry, you don't have access to this report

Upgrade your subscription plan to get access
Go to Dasboard
DATA &
TECHnologies
IndicatorEdge
‍
BackTestEdge
‍
Other Tools
‍
DataEdge API
RESEARCH
reports
Research Solution
‍
Reports Library
‍
actionable
Strategies
Trading Strategies
‍
Smart Stock Scanner
‍
FREE
RESOUrCES
Simple Backtest
Calculator
Simple Seasonality
Calculator
The Kelly Criterion
Calculator
Sentiment Geo Map
‍
Public Research Reports
‍
Free Webinar
COMPANY
‍
About
‍
Meet our Team
‍
In the News
‍
Testimonials
‍
Client Success Stories
Pricing
Bundle pricing
‍
Announcements
‍
FAQ
© 2024 Sundial Capital Research Inc. All rights reserved.
Setsail Marketing
TermsPrivacyAffiliate Program
Risk Disclosure: Futures and forex trading contains substantial risk and is not for every investor. An investor could potentially lose all or more than the initial investment. Risk capital is money that can be lost without jeopardizing ones’ financial security or life style. Only risk capital should be used for trading and only those with sufficient risk capital should consider trading. Past performance is not necessarily indicative of future results.

Hypothetical Performance Disclosure: Hypothetical performance results have many inherent limitations, some of which are described below. No representation is being made that any account will or is likely to achieve profits or losses similar to those shown; in fact, there are frequently sharp differences between hypothetical performance results and the actual results subsequently achieved by any particular trading program. One of the limitations of hypothetical performance results is that they are generally prepared with the benefit of hindsight. In addition, hypothetical trading does not involve financial risk, and no hypothetical trading record can completely account for the impact of financial risk of actual trading. for example, the ability to withstand losses or to adhere to a particular trading program in spite of trading losses are material points which can also adversely affect actual trading results. There are numerous other factors related to the markets in general or to the implementation of any specific trading program which cannot be fully accounted for in the preparation of hypothetical performance results and all which can adversely affect trading results.

Testimonial Disclosure: Testimonials appearing on this website may not be representative of other clients or customers and is not a guarantee of future performance or success.