
The collar strategy: A lesson in hedging with options

Key Points
- The options "collar" strategy typically involves buying a put and selling a call against shares of stock you hold
- The collar can offer a very low-cost temporary hedge
- A collar can be placed anytime, but is most commonly used leading up to major corporate announcements (ex., earnings) or after a stock is deemed "overbought" but you don't want to sell the shares
The basics of an options "collar"
A long collar generally involves three positions:
- Long 100 shares of stock
- Long one protective put option
- Short one out-of-the-money call option
All three positions can be entered simultaneously; however, the option positions are most commonly added simultaneously as a hedge against a potential adverse move by a stock already held.
The first two elements alone amount to a strategy known as a "married put." With that strategy, buying a put option limits the downside risk. The "collar" strategy adds a short call option to the mix. Selling the call option reduces the cost of the protective put.
A collar can temporarily offer a relatively inexpensive way to limit downside risk. The tradeoff is that a long 100-shares/short one call/long one put position also temporarily limits upside potential. So an investor must be either pretty concerned about a short-term pullback (ex., 14-day RSI for a stock held rises to 75 or higher, suggesting the potential for a reversion to the mean shortly) and/or willing to temporarily forego unlimited upside potential (impending major corporate announcement that could go either way).
The key decisions for an investor are:
- Whether to bother with a hedge at all?
- What expiration month to use?
- Which specific strikes to use?
There are no hard and fast rules or answers to the questions above, only relative pros and cons. Whether or not to hedge is entirely up to the individual investor. Regarding expiration month, since the hedge is usually temporary, it typically makes sense to use options in the 15 to 50-day range. These are usually the most actively traded, offering better bid/ask spreads than longer-dated options. Regarding strike prices to use, let's illustrate the strategy and these considerations with some examples.
A Disney (DIS) long collar
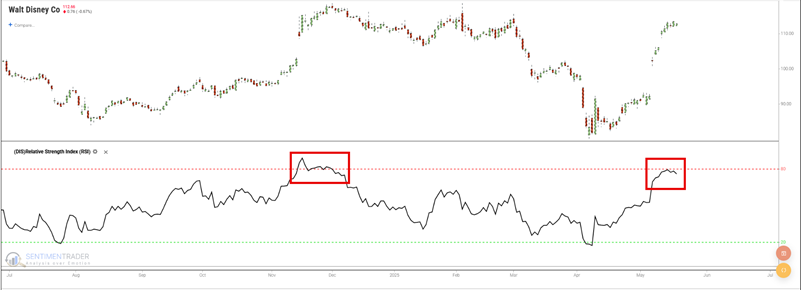
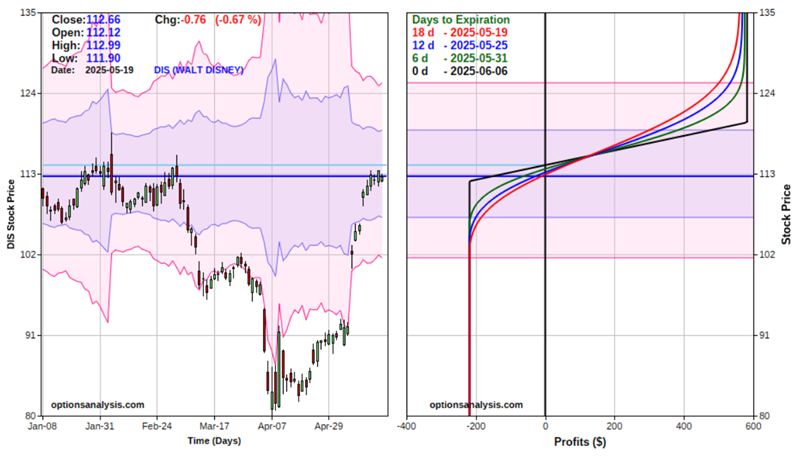
The chart below shows that Disney (DIS) stock has recently rallied 42% in just over a month and that the RSI exceeded 78%, suggesting a very "overbought" situation. So, let's assume an investor holding 100 shares decides to hedge against a short-term pullback.
Let's start with a collar that focuses on "low cost." The "quick and dirty" approach involves buying a put option with a "delta" near -40 and selling a call with a delta near 40. However, note that this is often not the ideal hedge. We use it here as a baseline to compare another choice to.
NOTE: "Delta" tells us roughly the "stock equivalent" position. For example, a long call position holding a 40-delta call will behave roughly like a position holding 40 shares of the underlying stock.
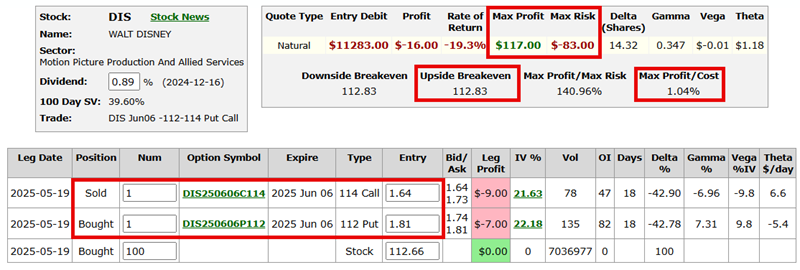
In this example, with DIS shares trading at $112.66 a share, an investor could buy one 112 strike price put expiring on June 6 for $1.81 (or $181, as each option is for 100 shares of stock), and sell one 114 strike price call expiring on June 6 for $1.64 (or $161).
- Long 100 shares of DIS trading @ $112.66
- Long 1 June06 DIS 112 put @ $1.81
- Short 1 June06 DIS 114 call @ $1.64
The bottom line in this example is that the investor pays $17 ($181 paid to buy the put and $164 taken in to sell the call) to enter the collar. The figure below displays the particulars (all subsequent screenshots are courtesy of www.Optionsanalysis.com)
The chart below displays the "risk curves" for this collar position. Notes that there are four different lines, each with a different color. Each line represents the expected $P/L as of a different date based on the price of DIS shares. The lines change over time due to time decay ("time decay" refers to the fact that every option will lose its time premium by expiration day). Note that both profit potential and maximum dollar risk are quite constrained.
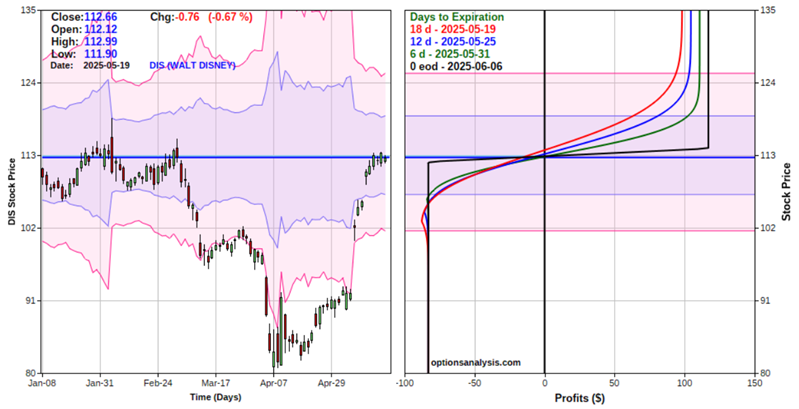
Key things to note:
- To add this collar to an existing long 100 shares position would cost $17 (paid $181 for the put, took in $164 for the short call)
- If we assume for illustrative purposes that all three legs were entered at once (i.e., including buying 100 shares at the current price of $112.66), the cost to enter the position would be $11,283 ($11,266 to buy 100 shares of DIS and $17 for the collar)
- The breakeven price is the cost of the stock plus the cost of the collar, or $11,266 + $17, or $11,283 divided by 100 shares equals $112.83
- The long 112 put entirely offsets any loss for the stock below $112 a share, so the worst-case loss as long as the hedge is held is -$83
- The tradeoff is that if DIS stock moves above the 114-strike price for the call, any gain in the stock will be offset by the short call position (i.e., every $1 gain for the stock above $114 a share involves a loss of $1 for the short call)
- The maximum profit potential while this particular collar is held is just $117
The key attraction of this collar position is the ability to limit maximum risk to just $83. The tradeoff is the elimination of upside potential beyond $114. Also, investors must understand that if DIS does rise above the call strike price of $114, the call may be "exercised," and their stock shares could be "called away." So an investor placing a collar must have a contingency plan for what to do if the stock price rises above the short call strike price (one typical adjustment is "rolling up", i.e., buying back the short call and selling another call with a higher strike price).
A "looser" collar
As we saw in the example above:
- The positive to selling at-the-money or slightly out-of-the-money call option as part of a hedge is that doing so can pay for much or all of the cost of the put option
- The negatives are the severe limitation to upside potential and the possible need to adjust the position to avoid having the stock shares called away if the stock rises only a little
So, let's consider a less extreme collar that involves:
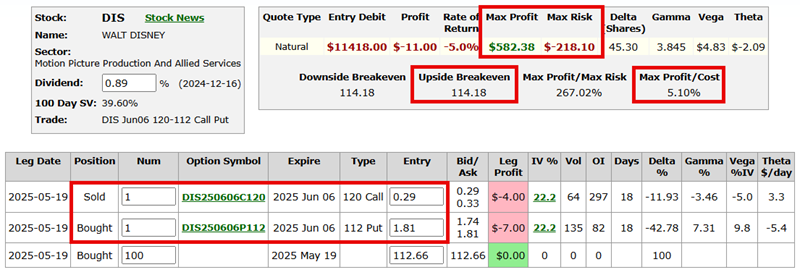
- Long 100 shares of DIS trading @ $112.66
- Long 1 June06 DIS 112 put @ $1.81
- Short 1 June06 DIS 120 call @ $0.29
The figure below shows the particulars for this position.
The chart below displays the "risk curves" for this collar position.
Key things to note:
- To add the collar to an existing long 100 shares position would cost $152 (paid $181 for the put, took in $29 for the short call)
- If we assume for illustrative purposes that all three legs were entered at once (i.e., including buying 100 shares at the current price of $112.66), the cost to enter the position would be $11,418 ($11,266 to buy 100 shares of DIS and $152 for the collar)
- The breakeven price for the combined position is $114.18
- The maximum loss on this position is -$218
- The maximum profit potential while this particular collar is held is just $582
The key attraction of this collar position is the ability to limit maximum risk to just $218. Likewise, unlike the previous example, the investor does not need to worry about adjusting the short call or risking stock shares being called away unless and until DIS shares exceed $120 a share.
Understanding your position
The screenshot and chart below display the particulars and risk curves for both collar examples highlighted above.
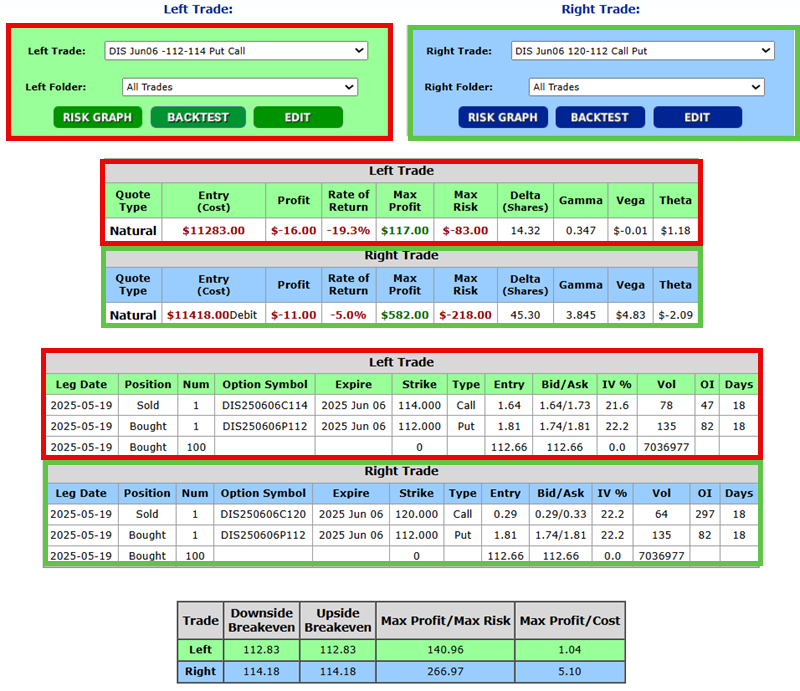
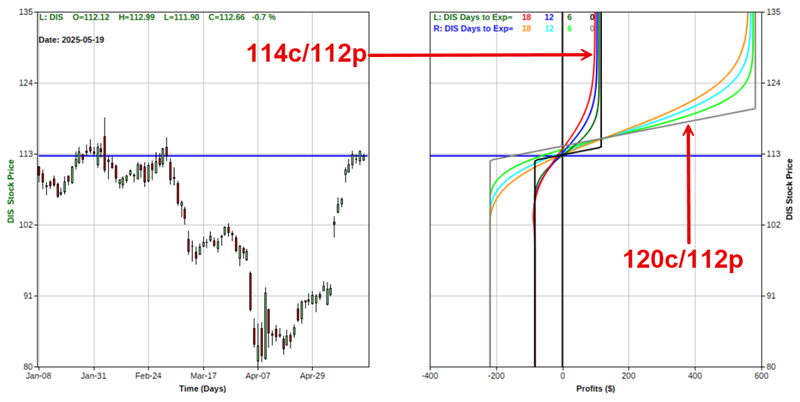
The risk curves graph shows the tradeoff between the two positions. The 114 call/112 put position locks the potential P/L into a narrow range. The 120 call/112 put position provides a broader range and a more favorable reward-to-risk tradeoff, but does carry a greater maximum risk.
Finally, the chart below compares the risk curves for the 120 call/112 put position to the expected P/L for holding 100 shares of DIS stock.
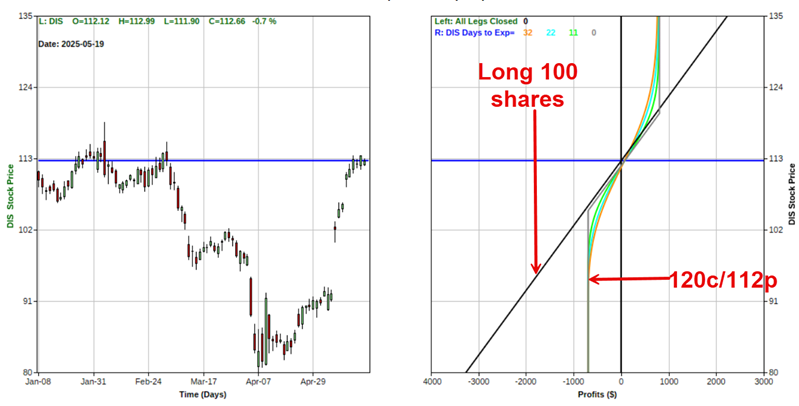
Once again, the tradeoff is readily apparent. An investor who puts on the collar temporarily limits upside profit potential to put an absolute limit on downside risk temporarily.
What the research tells us…
A collar can be added or removed quickly and efficiently to hedge any stock position. The key considerations are a) How long do you expect to hold the position, and b) what type of tradeoff between potential reward and risk are you looking for? In most cases, less potential risk also equates to less profit potential.