Data &
Technology
Research
Reports
Report Solutions
Reports Library
Actionable
Strategies
Free
Resources
Simple Backtest Calculator
Simple Seasonality Calculator
The Kelly Criterion Calculator
Sentiment Geo Map
Public Research Reports
Free Webinar
Pricing
Company
About
Meet Our Team
In the News
Testimonials
Client Success Stories
Contact
Log inLoginSign up
< BACK TO ALL REPORTS

The chances for an imminent correction just cratered

Jason Goepfert
2021-10-26
The advance/decline line just broke out to a new high, which suggests a smaller probability of a major decline in the months ahead.

The most benchmarked index in the world is trying to hold a breakout to record highs. Supporting its case is the fact that most of its stocks have been rising, and breadth within the index confirms its good performance.

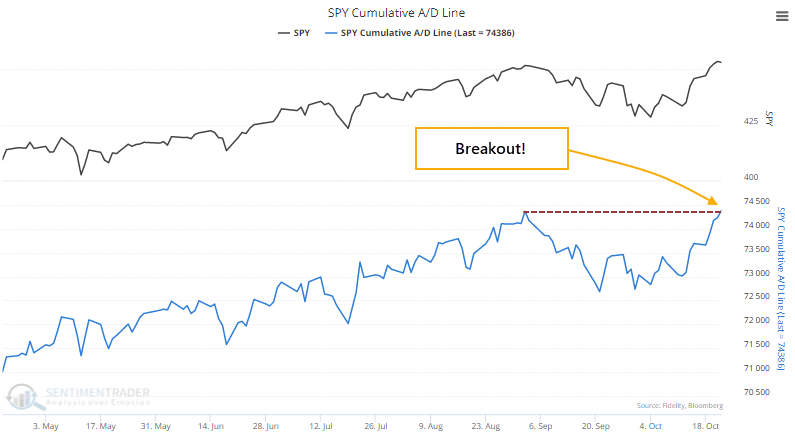
Even though the S&P 500 settled back a bit on Friday, most of the stocks in the index gained ground. That was enough to push the S&P's Cumulative Advance/Decline Line to a new high, the first in more than 30 sessions.

S&P advance decline line has broken out to a new high

Among other major indexes, the Nasdaq 100 has also seen a breakout in its Advance/Decline Line but other indexes have not.

Many times over the past couple of decades, we've discussed the idea that stocks are less likely to suffer a large drawdown in the following months when the advance/decline line breaks out to a new high.

Since 1928, the S&P 500 was three times more likely to suffer a 10% decline at some point within the next three months if the S&P's Advance/Decline Line was not at a multi-year high. When it did break out to a new high, there was only a 4.6% probability of a 10% or greater decline within the next few months.


What else we're looking at

  • More details on the Advance/Decline Lines for other indexes
  • Probabilities of various sized declines after the S&P's A/D Line makes a new high
  • The S&P just triggered an ATR reversal signal
  • Why the Consumer Staples sector looks interesting right now

Stat box

The VNQ real estate ETF has averaged an inflow of more than $100 million per day over the past week, the 15th time it has crossed that threshold in the past decade.

Etcetera

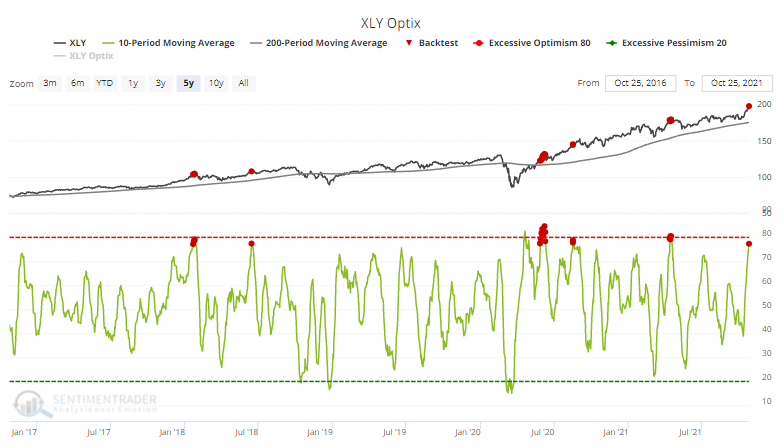
Discretionary spending. Investors are paying up for Consumer Discretionary stocks, and the 10-day Optimism Index has climbed above 77%. That ranks among the top 50 days since the fund's inception when the XLY fund was in a defined uptrend.

Optimism on consumer discretionary stocks is high

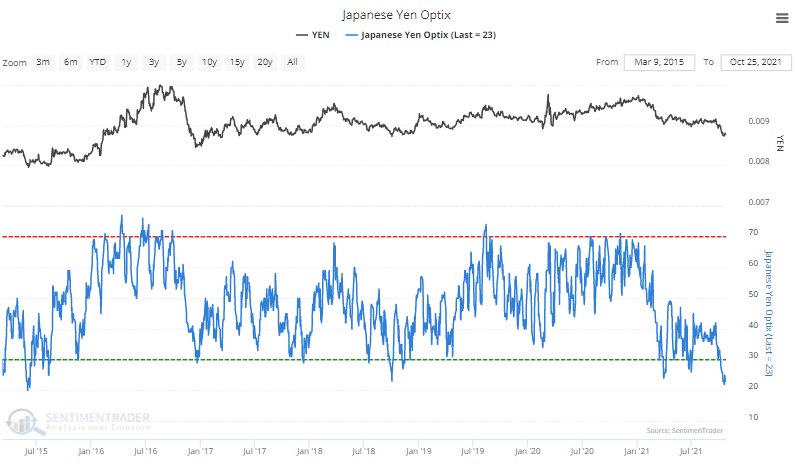
Nippon nipped. The Japanese yen has been mired in a downtrend and pessimism is rampant. The Optimism Index on the yen, near 20%, is the lowest since 2015.

Extreme pessimism in the Japanese yen

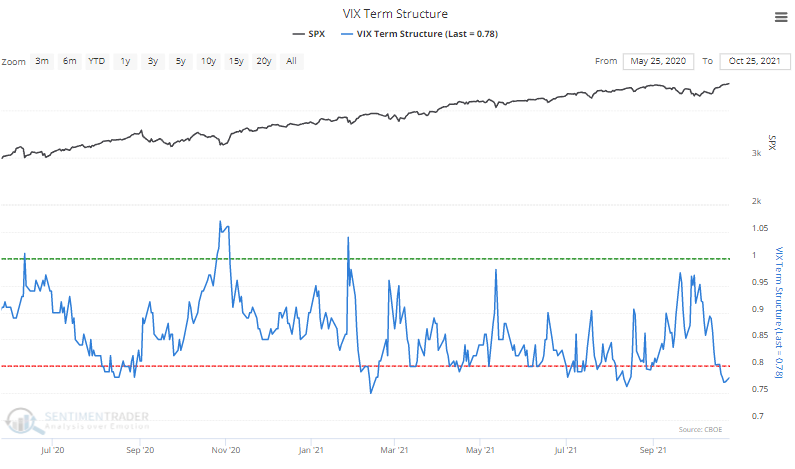
No fear. Options traders have basically given up on betting on a quick, severe decline in stocks. That lack of concern has caused the implied volatility of shorter-term options to be significantly less than longer-term ones.

The VIX term structure shows complacency

DATA &
TECHnologies
IndicatorEdge
‍
BackTestEdge
‍
Other Tools
‍
DataEdge API
RESEARCH
reports
Research Solution
‍
Reports Library
‍
actionable
Strategies
Trading Strategies
‍
Smart Stock Scanner
‍
FREE
RESOUrCES
Simple Backtest
Calculator
Simple Seasonality
Calculator
The Kelly Criterion
Calculator
Sentiment Geo Map
‍
Public Research Reports
‍
Free Webinar
COMPANY
‍
About
‍
Meet our Team
‍
In the News
‍
Testimonials
‍
Client Success Stories
Pricing
Bundle pricing
‍
Announcements
‍
FAQ
© 2024 Sundial Capital Research Inc. All rights reserved.
Setsail Marketing
TermsPrivacyAffiliate Program
Risk Disclosure: Futures and forex trading contains substantial risk and is not for every investor. An investor could potentially lose all or more than the initial investment. Risk capital is money that can be lost without jeopardizing ones’ financial security or life style. Only risk capital should be used for trading and only those with sufficient risk capital should consider trading. Past performance is not necessarily indicative of future results.

Hypothetical Performance Disclosure: Hypothetical performance results have many inherent limitations, some of which are described below. No representation is being made that any account will or is likely to achieve profits or losses similar to those shown; in fact, there are frequently sharp differences between hypothetical performance results and the actual results subsequently achieved by any particular trading program. One of the limitations of hypothetical performance results is that they are generally prepared with the benefit of hindsight. In addition, hypothetical trading does not involve financial risk, and no hypothetical trading record can completely account for the impact of financial risk of actual trading. for example, the ability to withstand losses or to adhere to a particular trading program in spite of trading losses are material points which can also adversely affect actual trading results. There are numerous other factors related to the markets in general or to the implementation of any specific trading program which cannot be fully accounted for in the preparation of hypothetical performance results and all which can adversely affect trading results.

Testimonial Disclosure: Testimonials appearing on this website may not be representative of other clients or customers and is not a guarantee of future performance or success.