
The "can't stop, won't stop" rally. What you really need to know.
Going forward I will publish a weekly summary note which highlights what factors are most important to understanding the markets right now. These important factors may stay consistent from time to time (e.g. sentiment is consistently high over the past month), so each weekly summary may have some overlap with the previous one.
Stock markets ranging from the U.S. to China have rallied significantly in recent months. The stock market rally (and in particular the nonstop tech rally) has generated a "trading is easy, can't lose money" mentality among many speculators. In this post I will highlight the most important risks I see right now, plus some additional factors that are worth mentioning but are less important. As usual, always think for yourself and don't let people push their market outlook on you. You are the master of your own portfolio.
So without further ado, we'll look at the following:
- Sentiment
- Options
- Once in a lifetime momentum
- The Wild, Wild (East)
- Valuations
Sentiment
Depending on which indicator(s) you look at, sentiment is either extremely frothy, or close to getting there. There's no single indicator that works "best", which is why we always look at the markets from multiple points of view.
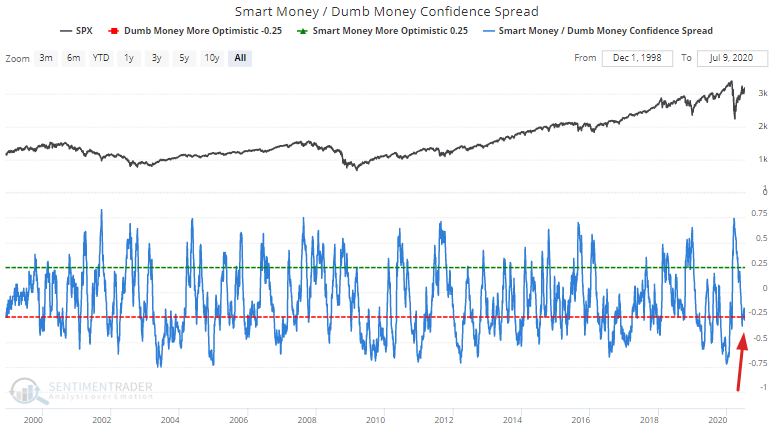
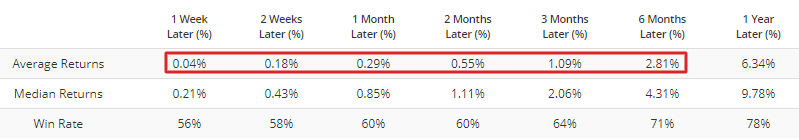
For example, our Smart Money / Dumb Money Confidence Spread is somewhat low. When the market started to show signs of excess optimism in the past, (indicator below -0.25), the S&P 500's average returns over the next few months were worse than random:
Another sentiment indicator I watch daily is our CNN Fear & Greed Proxy. This is not exactly the same as the Fear & Greed Index from CNN, but this is an approximation. So while exact numbers will differ from time to time, the trend in the data is the same.
Our CNN Fear Greed Proxy's 20 day average has turned down from extremely high readings (0.84). The last time this happened was before stocks crashed in February/March:
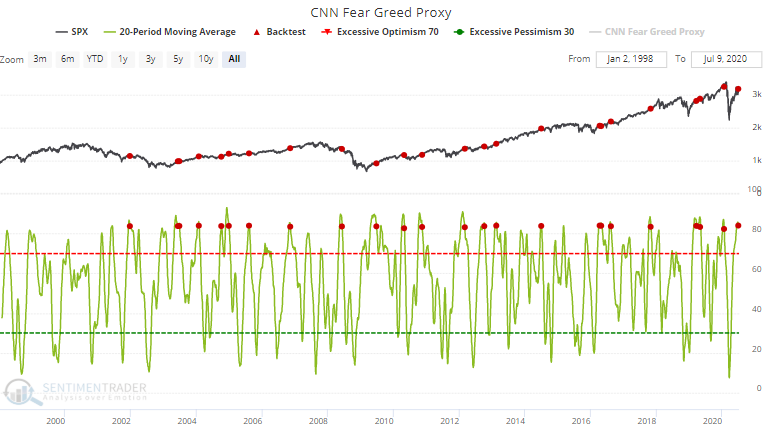
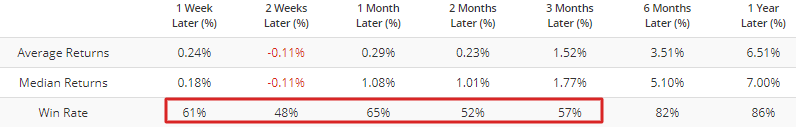
To avoid, recency bias, we can look at all the historical cases in which sentiment turned down from such extreme levels. Once again, this led to worse-than-average returns for U.S. equities over the next few months:
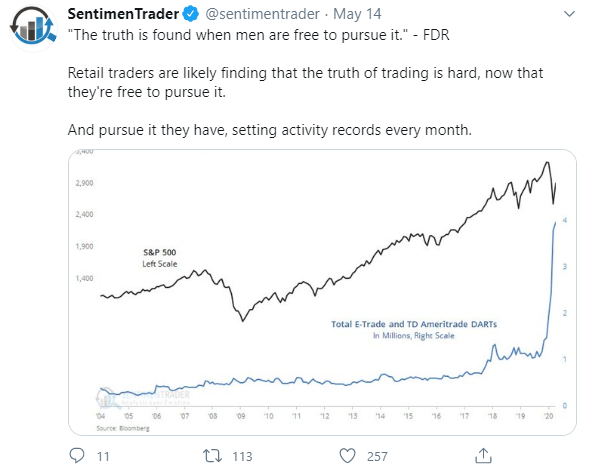
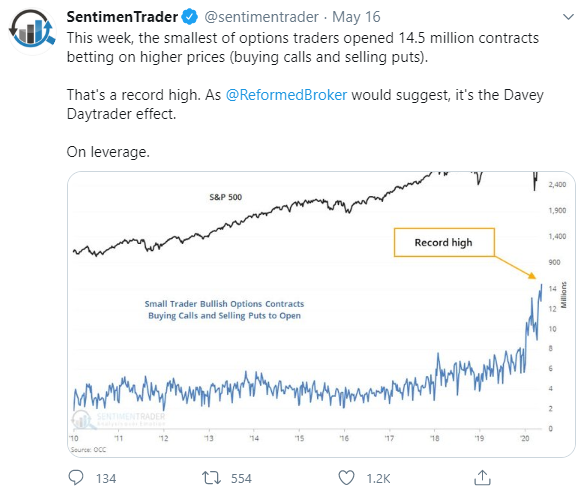
And as I'm sure you're aware of by now, options speculation has surged over the past few months. The surge in retail trading and options speculation is a concept that Jason first mentioned in mid-May. Since then, this topic has been copied/repeated over and over again on the internet/social media.
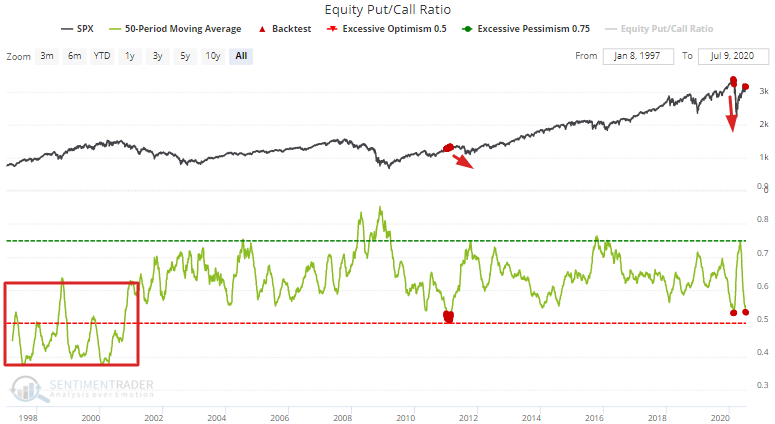
With that being said, the Equity Put/Call ratio's 50 day average is at a level that was rarely reached over the past 19 years. The ratio's 50 day average was only this low in the leadup to the 2011 market crash and this February/March's market crash.
As popular as the Put/Call ratio and Equity Put/Call ratio's are, applying a moving average isn't the best way to look at this indicator. I.e. you'll notice that the ratio's 50 day average was consistently lower pre-2001. We have a De-Trended Equity Put/Call Ratio to account for this upwards shift in the ratio since 2001. Once again, historical cases in which the ratio's 50 day average dropped this low (below -0.11) led to worse-than-random returns for the S&P over the next 2-3 months: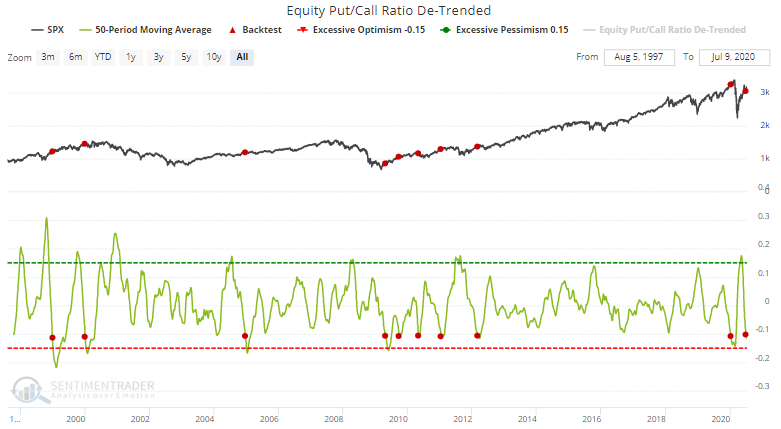
Once in a lifetime momentum
Social media is an interesting study in human psychology. In many ways, it's just one giant echo chamber that's designed to deliver to you the hypey-est hit of dopamine. Reading the comments below our Twitter accounts is particularly rewarding. Without calling individual people out (which is a very low thing to do, but some people still do it), many speculators on social media were insanely bearish in March and are now insanely bullish. Whereas in March we saw comments along the lines of:
- Never before was there a pandemic. We're all dead.
- Great Depression...
- S&P target 1000
...we now have comments along the lines of:
- Trading is so easy. I've made 150% on my tech stocks this year, and this bull market is just getting started.
- The last bull market lasted 11 years. We're only months into the current bull market.
- I make more money trading from my PJ's than I did at my old job.
In a way, it's understandable why so many traders are so optimistic. 50-100% gains in tech stocks (a favorite play among most of these traders) in less than 4 months is quite remarkable. But if trading were so easy, everyone would do it. And if everyone does it, it wouldn't be very profitable (increasing competition in any industry = lower profit margins). One has to wonder when the "tech will outperform everything" train will come to a screeching halt.
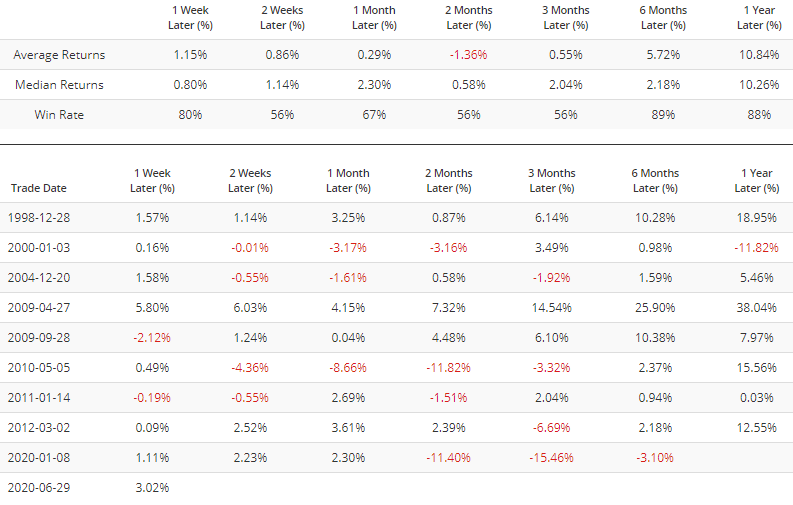
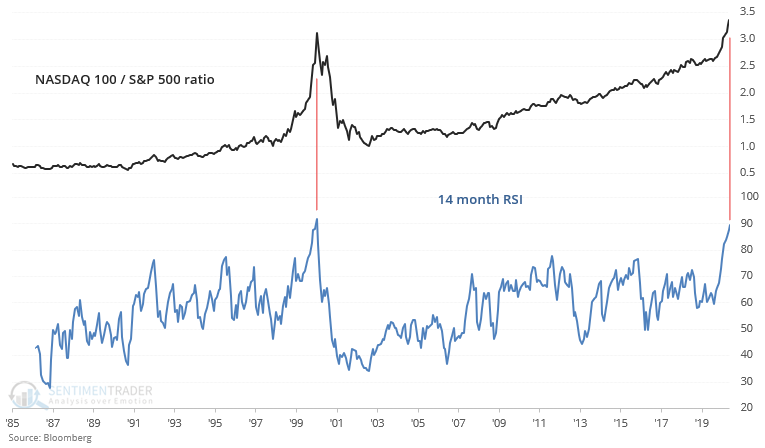
The first chart looks at the NASDAQ 100 / S&P 500 ratio, whose 14 month RSI is almost exactly where it was at the top of the dot-com bubble.
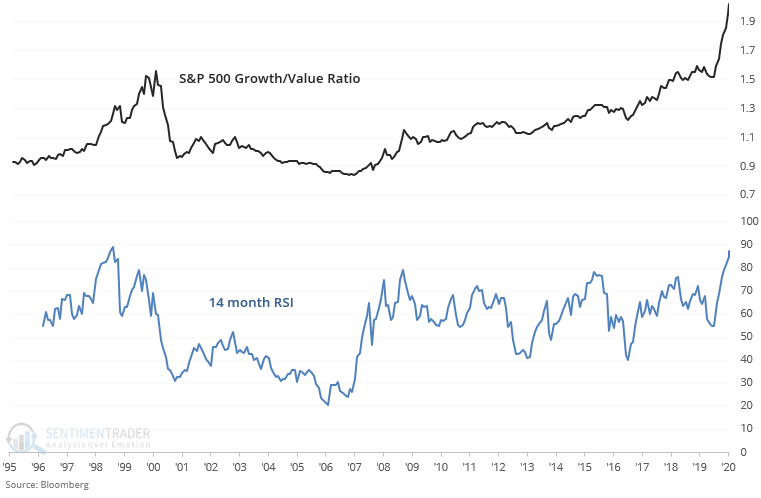
Looking at a similar ratio, the S&P 500 Growth/Value Ratio's 14 month RSI is close to an all-time high. The previous high occurred in late-1998, when the tech bubble still had another 1.5 years left:
So depending on how you look at it, whether the top is already in or we're about to experience a final blow-off top is yet to be determined. Either way, crazy tech speculation is not a good sign for risk-sensitive traders and investors. To quote one of my favorite lines (not exactly sure where this is from, perhaps Reminiscences of a Stock Operator), "the final 1/8th is the most expensive 1/8th". In trading as in life, picking up pennies and nickels in front of a steamroller is not a sound strategy. That strategy mints a few millionaires but also destroys many peoples' wealth.
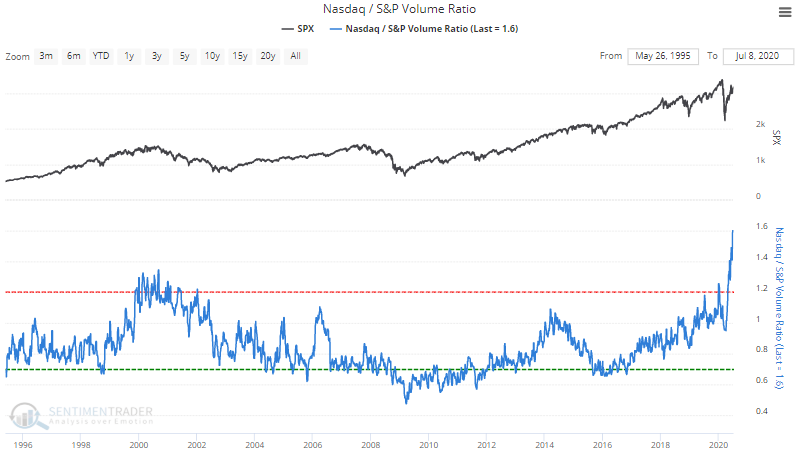
If you're not convinced that traders have rushed headlong into tech, just look at the ratio between NASDAQ and S&P Volume. There is some logic in the idea that "tech does better during a pandemic than non-tech companies", but taking that concept to an extreme (tech stocks should be bought at any price) is non-sensical. Price is what you pay, value is what you get.
Breadth issues
When we take a look under the hood we can see that in the U.S., tech stocks are really all that's pulling the overall market higher. Aside from tech, the U.S. stock market has been flat for weeks.
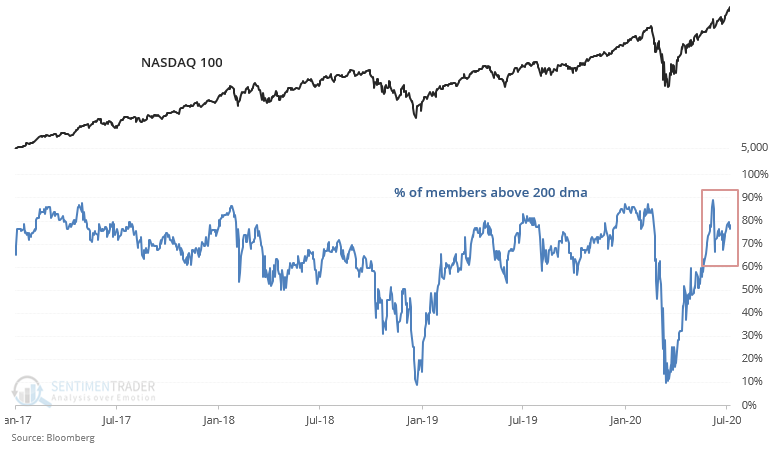
Weak breadth is a topic I originally covered here, and now this topic has been copied/pounded home on by others on social media. The NASDAQ continues to relentlessly make new all-time highs, and a healthy 75-80% of the NASDAQ 100's members are above their 200 dma (i.e. in a long term uptrend):
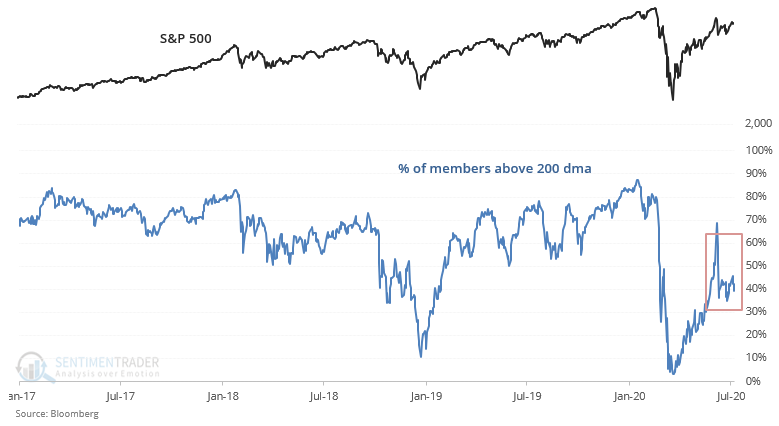
What's interesting is that in the meantime, relatively few of the broader S&P 500's members are above their 200 dma (less than half). This demonstrates a lack of broad participation in the "unstoppable" rally.
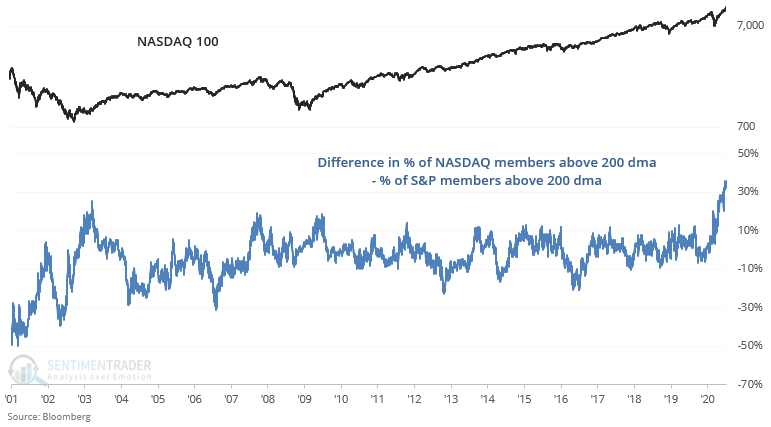
As a result, the gap between the % of NASDAQ 100 members above their 200 dma and the % of S&P 500 members above their 200 dma is at its widest level ever:
 While it's hard to draw strong conclusions from n=1, overall I would not consider this to be a healthy environment. Sooner or later every single "can't stop, won't stop" rally does end, especially when there's a lack of broad participation.
The Wild, Wild (East)
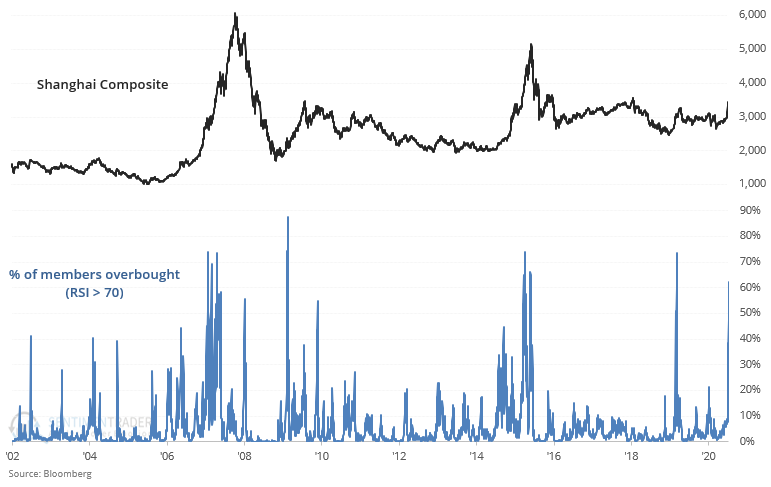
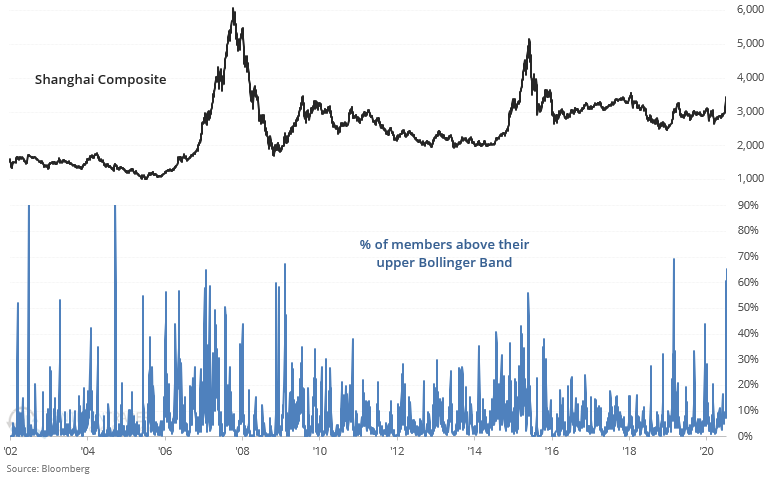
Chinese equities have always behaved somewhat differently from other countries' equity markets, perhaps due to heavier intervention in the Chinese stock market. Chinese equities have surged since the Chinese government stressed the need for a "healthy bull market".
In return, Chinese speculators have rushed headlong in stocks and bought everything they could get their hands on. This has resulted in widespread overbought conditions.
While such strong momentum can lead to a short term pullback, it sometimes did lead to an all-out bubble in Chinese stocks. Looking at a similar metric, an extremely large % of Chinese stocks have jumped above their upper Bollinger Band.
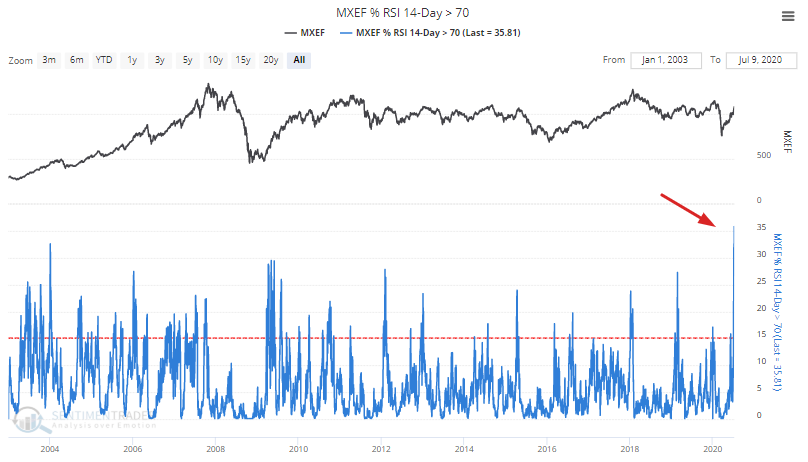
The ramp higher in Chinese stocks has lifted the MSCI Emerging Markets Index as well. A record % of its members are overbought.
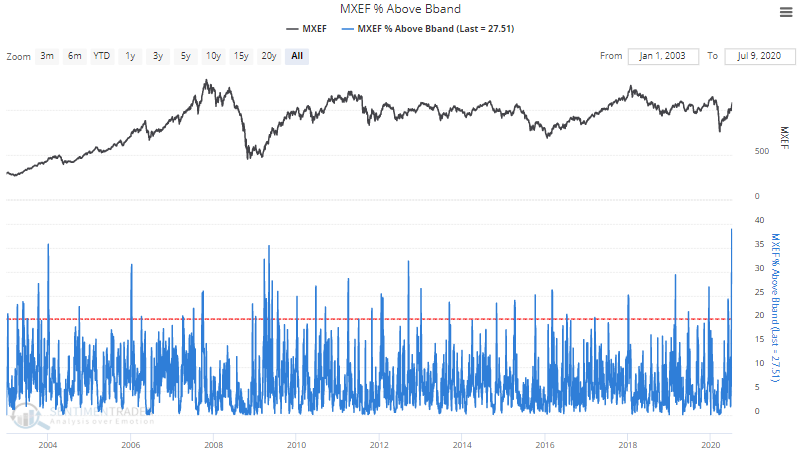
In addition, a record % of the EM Index's members are above their upper Bollinger Band.
Valuations
And lastly, I'd like to bring up the topic of valuations. Valuations don't really matter on a 1 month, 3 month, or even 1 year time frame. But valuations do matter on a 3-5 year time frame. So if you're a short term trader, please skip this part.
Recency bias is powerful, as humans we tend to extrapolate recent events/patterns into the future. So just because the last bull market lasted 11 years, there's a somewhat widespread belief nowadays that this new bull market has years and years of potential left. I'd like to challenge this thinking a little.
First, consider the S&P 500's forward p/e ratio. Not exactly "just like 2009", is it?
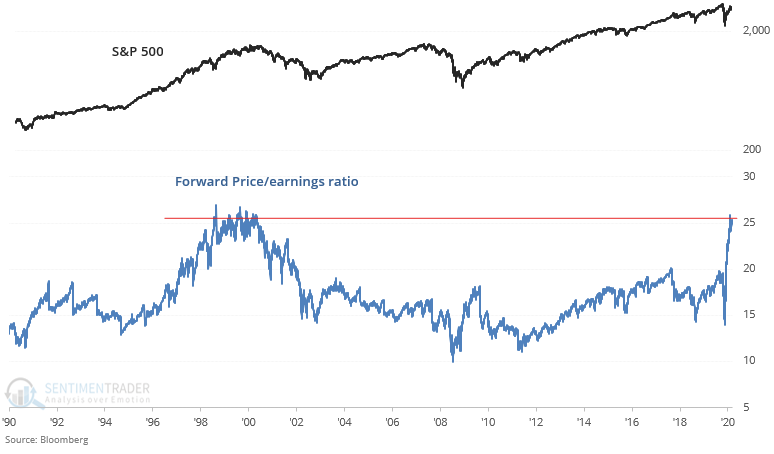
Granted, one could make the argument that "forward earnings are artificially depressed by the pandemic, and will bounce back. So P/E is artificially elevated". What if we looked at the S&P's trailing P/E ratio then? Once again, valuations are not cheap.
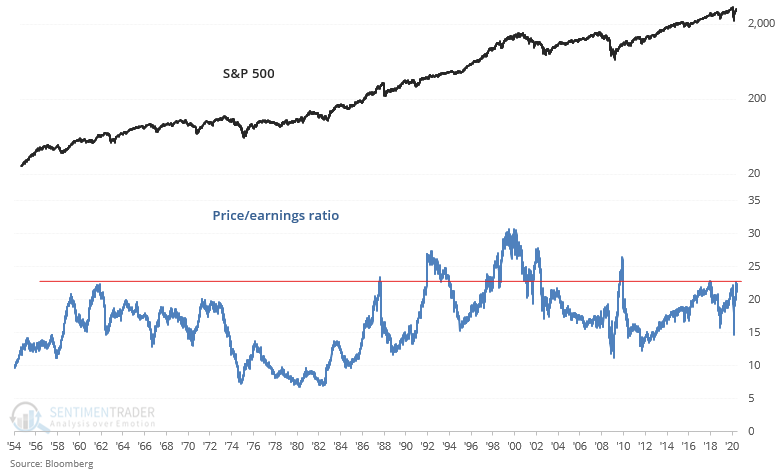
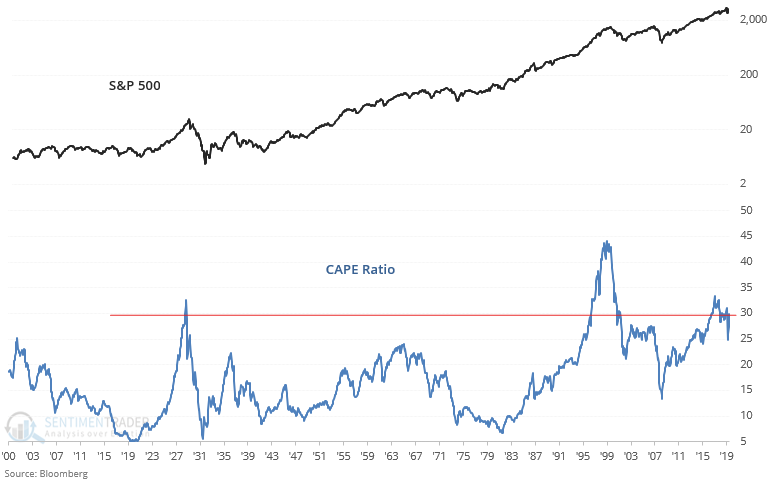
Looking at the above chart we can see that valuations are high near the end of a cycle, and are also high at the start of a cycle (when valuations eventually fall as earnings increase significantly). But in order for earnings to increase significantly, the economic cycle needs to have a reset. The following CAPE ratio demonstrates that today is significantly different from 2009. There hasn't been a strong reset in valuations yet.
One could make the argument that interest rates today are lower. While rates are somewhat lower than in 2009, valuations are SIGNIFICANTLY higher than in 2009. Rates haven't fallen enough to justify the lofty valuations.
Once again, remember the line from Buffett: "price is what you pay, value is what you get".
Wrapping up
No one has a crystal ball into how the future will play out. I hope these data points have been valuable to you and will help you in your understanding of the markets right now. Overall, there is significant risk in the U.S. stock market right now. This isn't to say that there aren't reasons to be bullish - there are always reasons to be both bullish and bearish. But the weight of the evidence (everything we've published here on SentimenTrader in recent weeks) suggests that the next few months will not be as kind to bulls as the past few months have been.
If you have any questions, feel free to send a message through the contact link or email me at [email protected]