
The bullish price momentum in Bitcoin could persist

Key points:
- After a brief dip following the introduction of spot Bitcoin ETFs, the digital asset has exploded to the upside
- Similar price behavior for Bitcoin suggests the upward trajectory will persist over the subsequent year
- When Bitcoin exhibited comparable price patterns to now, the S&P 500 was higher a year later every time
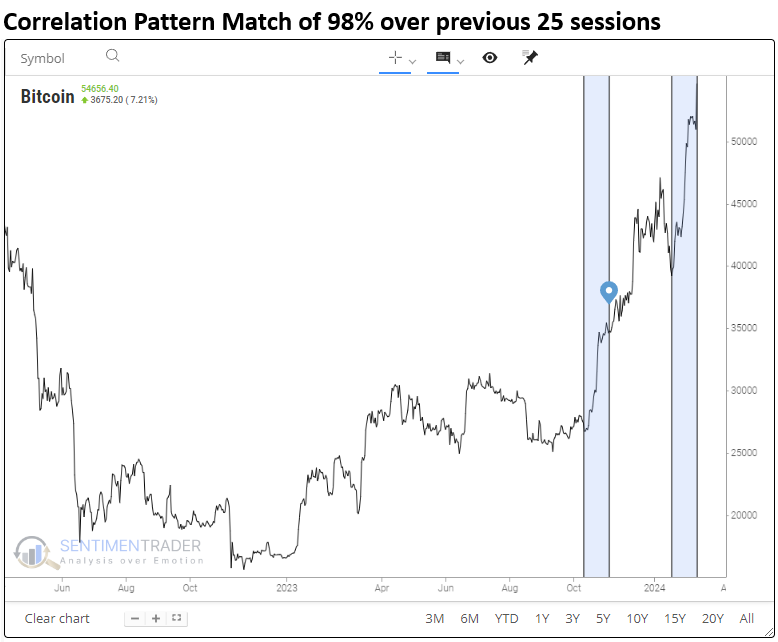
One of the more risky assets in the world is surging
The introduction of spot Bitcoin Exchange-Traded Funds marked a significant milestone in the evolution of the cryptocurrency market, providing traditional investors with a regulated and easily accessible avenue to gain exposure to digital assets.
After a brief dip, which was most likely a buy-the-rumor, sell-the-event scenario, Bitcoin has exploded higher since bottoming on 2024-01-23.
Using the new Correlation Pattern Match tool, let's identify periods in history resembling the price behavior around this pivotal event to see if the current upside momentum will persist.
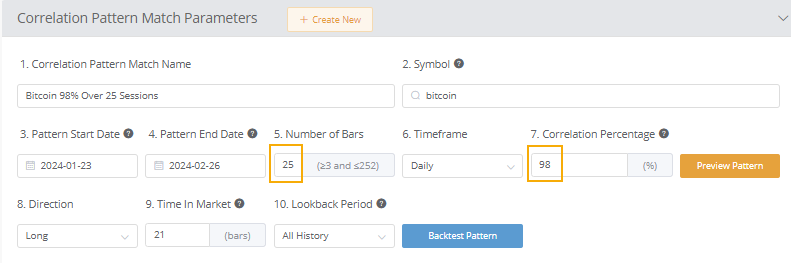
Correlation Parameters
The correlation interface below presents a summary of the parameters I employed to replicate price behavior resembling those of the past 25 sessions. When analyzing short-term time frames, I recommend opting for a high correlation percentage.
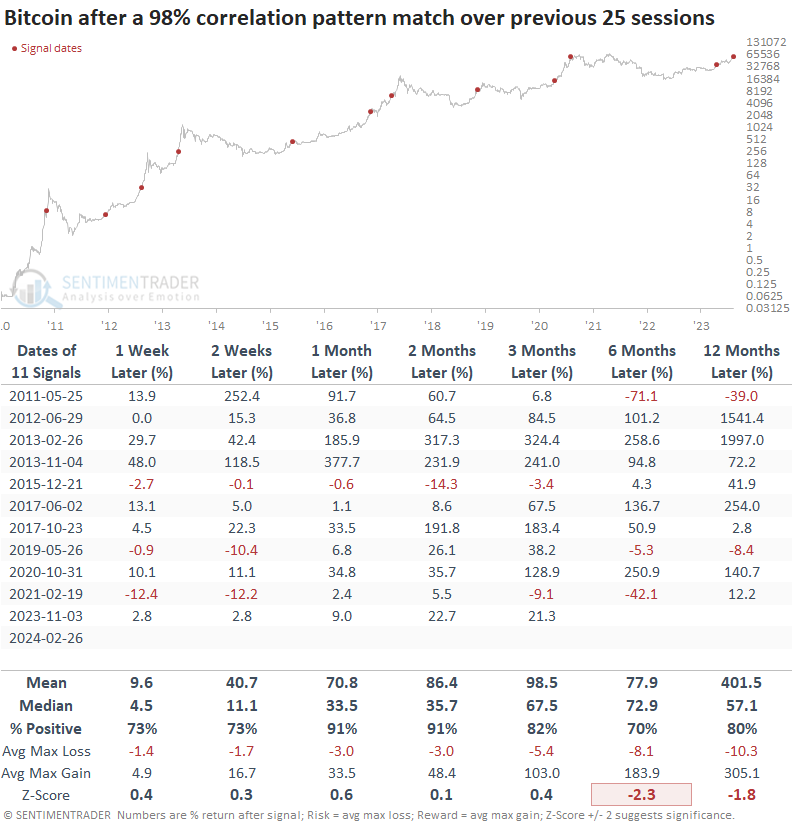
Similar price behavior preceded further gains
After similar short-term price analogs, like now, Bitcoin displayed excellent returns and win rates across all time horizons. More importantly, signals occurred within the context of uptrends, not downtrends. However, a few signals, like 2015 and 2021, triggered near medium-term peaks.
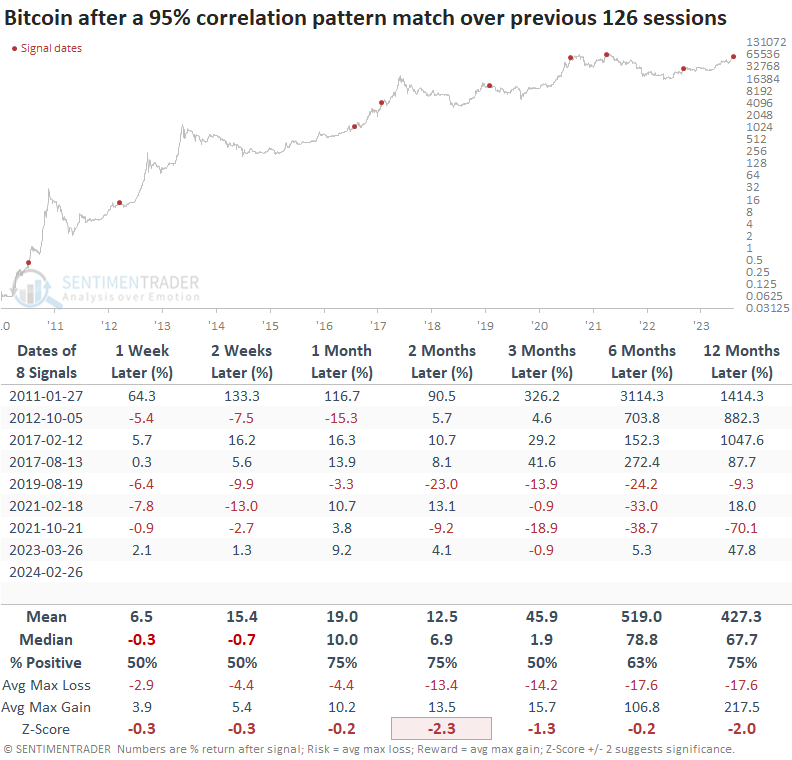
What does a long-term time horizon suggest about the outlook for Bitcoin?
Utilizing the CPM to detect price patterns resembling the prior 126 sessions with a correlation percentage of 95%, the tool identified eight other periods.
While results were somewhat mixed depending on the horizon, Bitcoin was higher at some point over the following three months in all but one case, 2019.
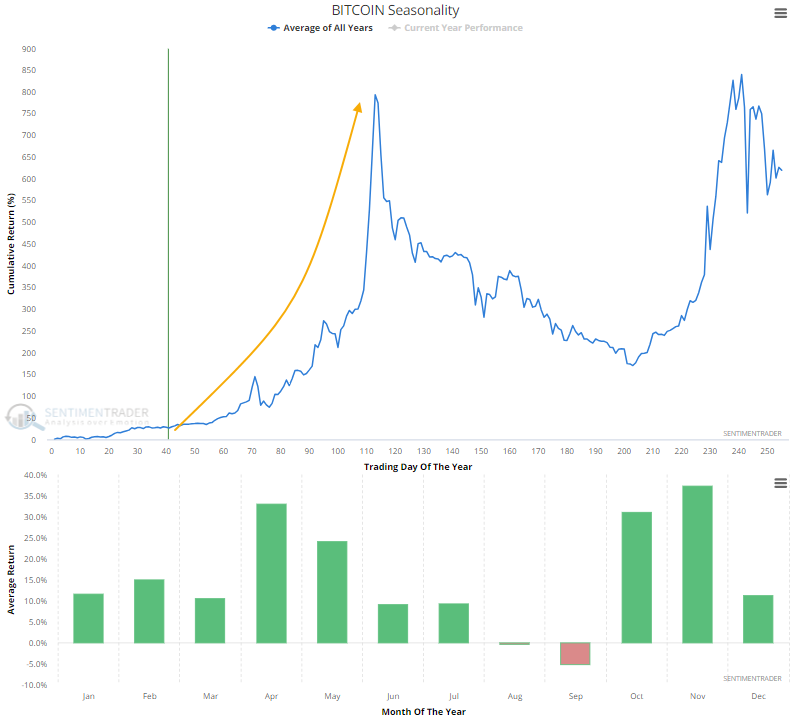
Seasonality
Bitcoin exhibits an extremely bullish seasonal bias in the first 113 trading days of the year, a pattern that looks fairly similar to other risk assets like stocks.
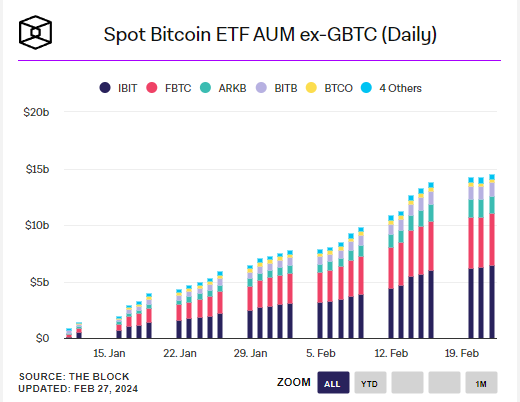
Fund flows
Arguably, fund flows are the most bullish factor for Bitcoin, with the chart below showing a steady upward increase over the last month. And that's with trading restrictions for Bitcoin ETFs on some of the largest wirehouse platforms in the world. So, once firms approve the ETFs, demand could increase further.
If you are interested in other charts like the one below from The Block, click here.
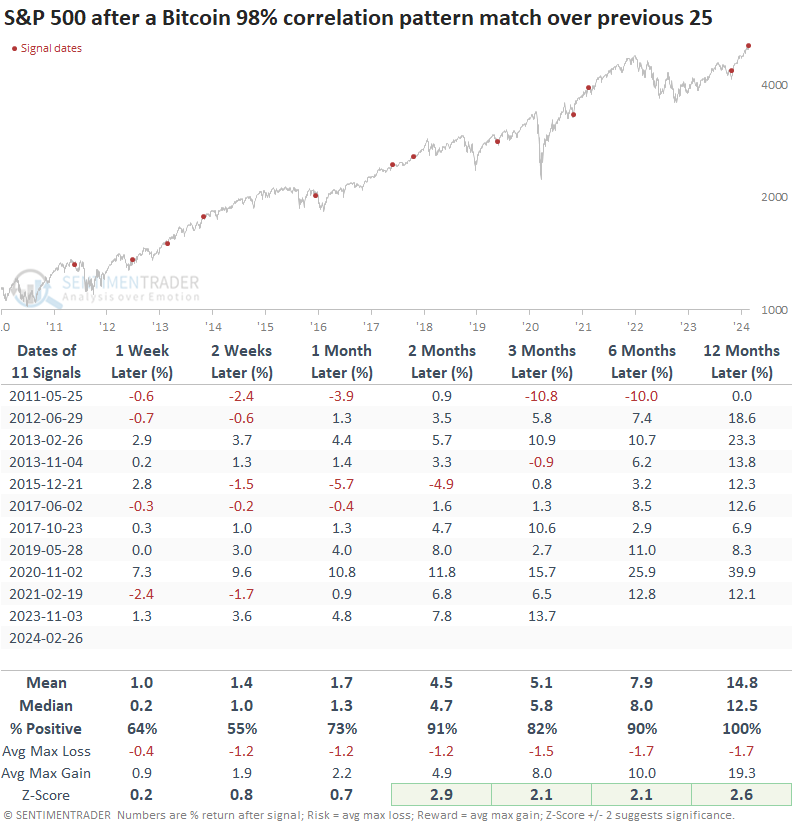
Risk Assets
The recent price behavior in Bitcoin tended to occur during favorable environments for stocks, with the S&P 500 displaying excellent medium and long-term results. A year later, the S&P 500 was higher every time. However, it was not without risk, as 2011 and 2015 show.
What the research tells us...
In the wake of the recent approval of spot Bitcoin ETFs, the digital asset experienced a notable price surge. Using the Correlation Pattern Match tool to compare the current price behavior to other similar historical periods suggests Bitcoin can go higher despite its extraordinary run. After similar analogs, Bitcoin was higher over the subsequent two and three months, 91% of the time. When Bitcoin exhibits bullish price momentum, the favorable backdrop benefits other risk assets like the S&P 500. Proper risk management is imperative for successfully navigating the markets. That's especially the case when trading a highly volatile asset like Bitcoin.