Data &
Technology
Research
Reports
Report Solutions
Reports Library
Actionable
Strategies
Free
Resources
Simple Backtest Calculator
Simple Seasonality Calculator
The Kelly Criterion Calculator
Sentiment Geo Map
Public Research Reports
Free Webinar
Pricing
Company
About
Meet Our Team
In the News
Testimonials
Client Success Stories
Contact
Log inLoginSign up
< BACK TO ALL REPORTS

The best momentum in 7 years

Jason Goepfert
2021-02-10
More than 80% of stocks in the S&P 500 have held above their 200-day moving averages for 3 straight months now.

Last November, we finally saw an overwhelming percentage of stocks within the S&P 500 that were able to climb above their 200-day moving averages, after almost all of them had been below. The few other times it cycled from an extremely low percentage to an extremely high one, it indicated long-term recoveries ahead.

So far, so good. And it still hasn't stopped.

A "normal" market sees some oscillations back and forth in the number of stocks in uptrends, but not this one. The percentage of stocks above their long-term averages has been stuck at a high level since that note three months ago.

Percent of S&P 500 members above 200 day moving average

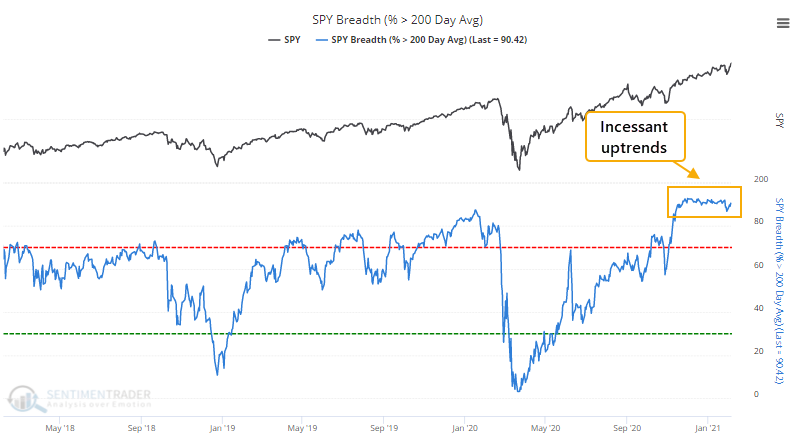
Going back to 1928, this is one of the longest streaks that so many stocks have traded above their 200-day moving averages. While it has continued for nearly 3 times as long, this is the most persistent streak in 7 years.

What else we're looking at

  • How stocks have responded since 1928 after streaks of long-term internal momentum like this
  • Including when it happens after NOT climbing out of a recent low
  • A rare breadth signal since 1928 across all U.S. stocks
  • A look at sentiment towards corn along with its seasonal tendencies

Stat Box

Many commodities have skyrocketed, and most are entering a consistent seasonal window. Among the positive is corn. From early February through late March, it has shown a gain during 43 years, while losing only 17 years.


Sentiment from other perspectives

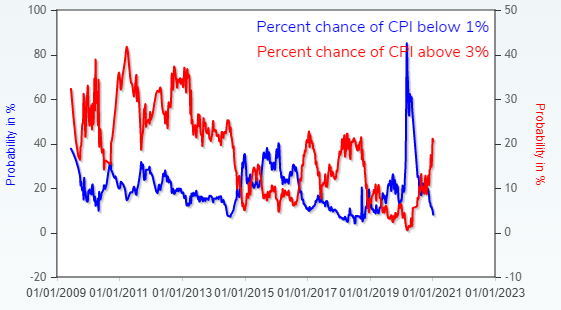
There is one thing that options traders are afraid of - inflation. According to options pricing, there is now the widest spread between fears of inflation running above 3% versus below 1% in more than 2 1/2 years. Source: Minneapolis Fed

inflation expectations

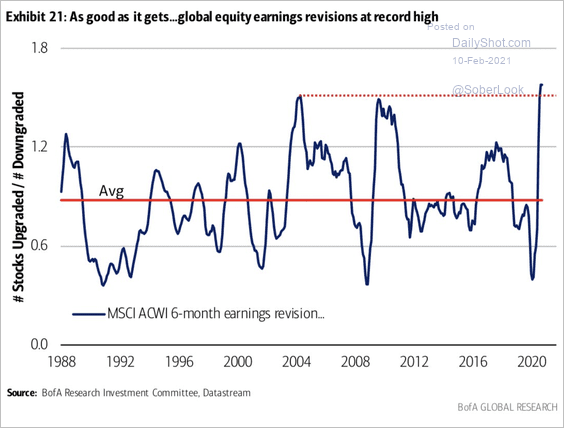
Wall Street has never been more optimistic. Analysts have been upgrading the earnings prospects on more stocks than ever, relative to those they're downgrading. Source: BofA via Daily Shot

earnings revisions

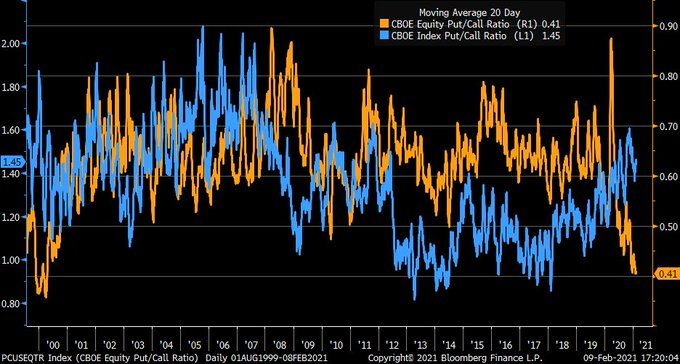
All those call options are in stocks. The put/call ratio for equity options is the lowest in 20 years, but traders haven't been so sanguine about the indexes, with the index put/call ratio holding at a high level. Source: Bloomberg via Liz Ann Sonders

equity versus index put call ratio

DATA &
TECHnologies
IndicatorEdge
‍
BackTestEdge
‍
Other Tools
‍
DataEdge API
RESEARCH
reports
Research Solution
‍
Reports Library
‍
actionable
Strategies
Trading Strategies
‍
Smart Stock Scanner
‍
FREE
RESOUrCES
Simple Backtest
Calculator
Simple Seasonality
Calculator
The Kelly Criterion
Calculator
Sentiment Geo Map
‍
Public Research Reports
‍
Free Webinar
COMPANY
‍
About
‍
Meet our Team
‍
In the News
‍
Testimonials
‍
Client Success Stories
Pricing
Bundle pricing
‍
Announcements
‍
FAQ
© 2024 Sundial Capital Research Inc. All rights reserved.
Setsail Marketing
TermsPrivacyAffiliate Program
Risk Disclosure: Futures and forex trading contains substantial risk and is not for every investor. An investor could potentially lose all or more than the initial investment. Risk capital is money that can be lost without jeopardizing ones’ financial security or life style. Only risk capital should be used for trading and only those with sufficient risk capital should consider trading. Past performance is not necessarily indicative of future results.

Hypothetical Performance Disclosure: Hypothetical performance results have many inherent limitations, some of which are described below. No representation is being made that any account will or is likely to achieve profits or losses similar to those shown; in fact, there are frequently sharp differences between hypothetical performance results and the actual results subsequently achieved by any particular trading program. One of the limitations of hypothetical performance results is that they are generally prepared with the benefit of hindsight. In addition, hypothetical trading does not involve financial risk, and no hypothetical trading record can completely account for the impact of financial risk of actual trading. for example, the ability to withstand losses or to adhere to a particular trading program in spite of trading losses are material points which can also adversely affect actual trading results. There are numerous other factors related to the markets in general or to the implementation of any specific trading program which cannot be fully accounted for in the preparation of hypothetical performance results and all which can adversely affect trading results.

Testimonial Disclosure: Testimonials appearing on this website may not be representative of other clients or customers and is not a guarantee of future performance or success.