
The Benner Cycle - Part III

Key points
- The chart below was purportedly created by a man named Samuel Benner in 1875
- In Part I, we looked at stock market performance during major cycle favorable and unfavorable periods
- In Part II, we looked at stock market performance during minor cycle favorable and unfavorable periods
- In Part III, we will look at those times when both the major and minor cycles are aligned
The "Benner Cycle" chart
The chart below was purportedly created by Samuel Benner in 1875.
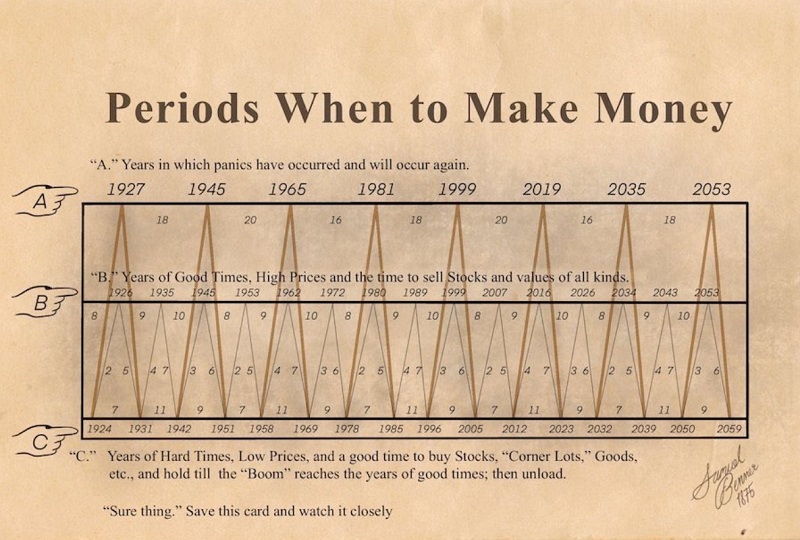
The "major cycle" is represented by the orange/yellow line. The light gray line represents the "minor" cycle.
For this piece, we will look only at those times when both major and minor cycles are simultaneously favorable or unfavorable.
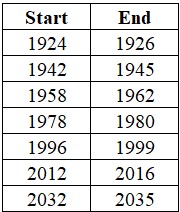
Favorable years for both major and minor cycles
The list below displays all the years when both major and minor cycles were favorable.
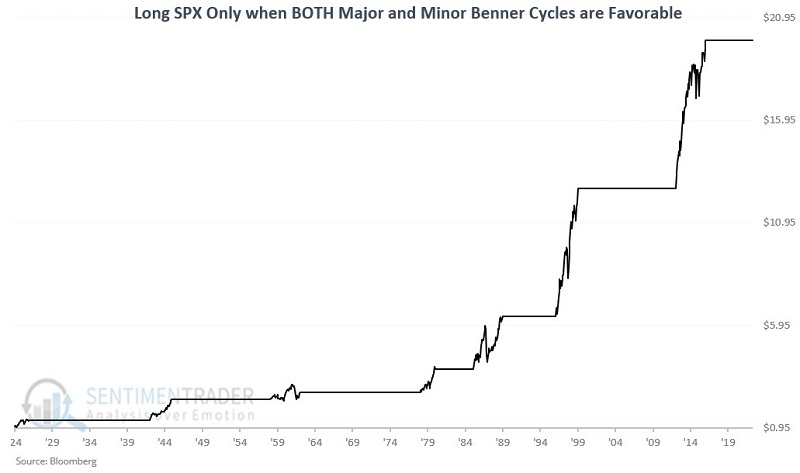
The chart below displays the growth of $1 invested only during the periods listed above.
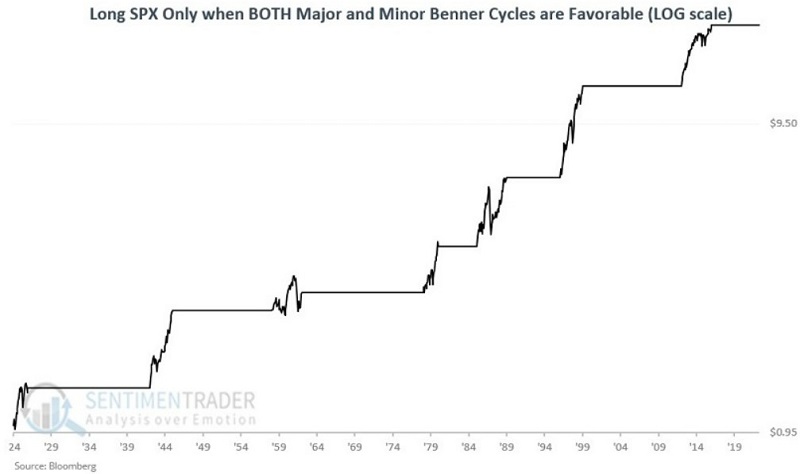
The chart below displays the same results on a logarithmic scale.
The table below displays the cycle-by-cycle results.
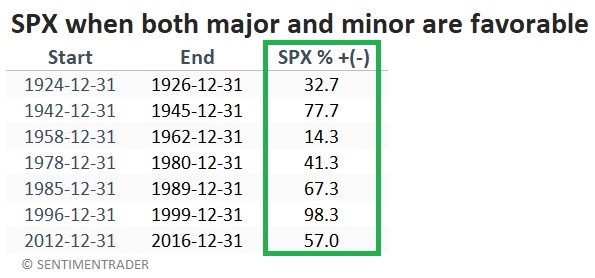
The good news is that in the past 100 years, overall market performance has been uniformly positive during favorable years for both the major and minor Benner cycles. The bottom line: When both cycles are favorable, investors have done well to give the bullish case the benefit of the doubt. The bad news is that the next joint favorable period will not begin until the end of 2032 and will extend only through 2035.
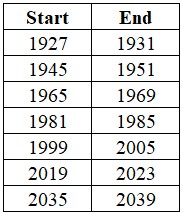
Unfavorable years for both major and minor cycles
The list below displays all the years when both major and minor cycles were unfavorable.
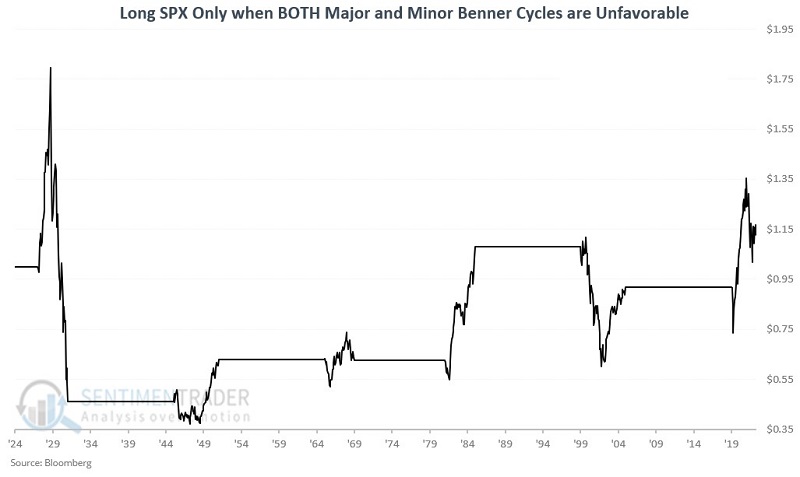
The chart below displays the growth of $1 invested only during the periods listed above.
The table below displays the cycle-by-cycle results.
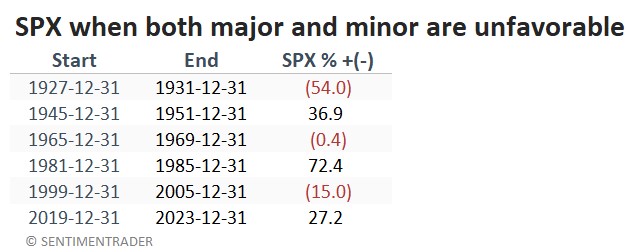
Interestingly, these supposedly joint unfavorable periods have alternated between showing a loss and then a gain. The most recent unfavorable period began at the end of 2019 and showed an increase of +27% through March 2023. Of course, along the way, investors endured the 2020 Covid-related selloff and the 2022 bear market. This unfavorable period extends through 2023-12-31.
What the research tells us…
Favorable periods for the major and minor Benner cycles have witnessed reliable gains in the stock market over the past 100 years. The major cycle will not be favorable again until the end of 2032. However, the also reliable minor cycle will be favorable from the end of 2023 through the end of 2026. The Benner cycle does not constitute a trading system per se. Nevertheless, the key takeaway is that long-term investors should likely give the bullish case the benefit of the doubt during 2024-2026, particularly if price action is not in an established downtrend.