The Benner Cycle - Part II
Key points
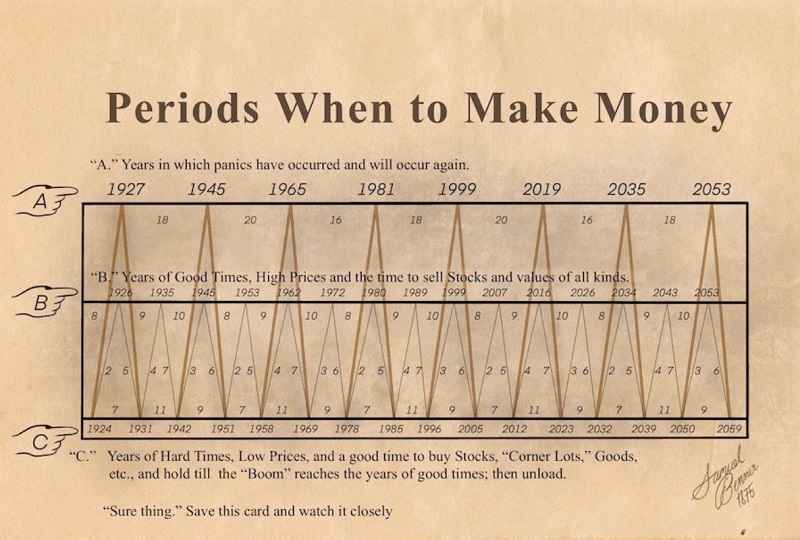
- The chart below was purportedly created by a man named Samuel Benner in 1875
- In Part I, we looked at stock market performance during major cycle favorable and unfavorable periods
- In Part II, we will look at stock market performance during minor cycle favorable and unfavorable periods
The "Benner Cycle" chart
The chart below was purportedly created by Samuel Benner in 1875.

The "minor" cycle (the light gray line) starts by rising from 1924 to 1926 (favorable), then declines from 1926 to 1931. It then rises for four years and declines for 7, then completes its pattern by increasing for three years, then falling for 6. From there (1951), the overall pattern repeats.

For this piece, we will look only at the "minor cycles" - i.e., the light gray line that starts by rising from 1924 to 1926 (bullish), then declines from 1926 to 1931 (bearish). Let's look first at "favorable" years within the minor Benner cycle.
Favorable years within the minor Benner cycle
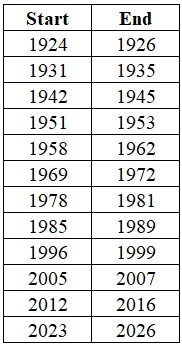
The list below contains all the "favorable" years the minor Benner cycle indicated. Note that for all tests, we start a new cycle period at the close on December 31st of the stated year and use monthly S&P 500 Index closing prices to track results. So the next minor cycle favorable period begins 2023-12-31 and extends through 2026-12-31.
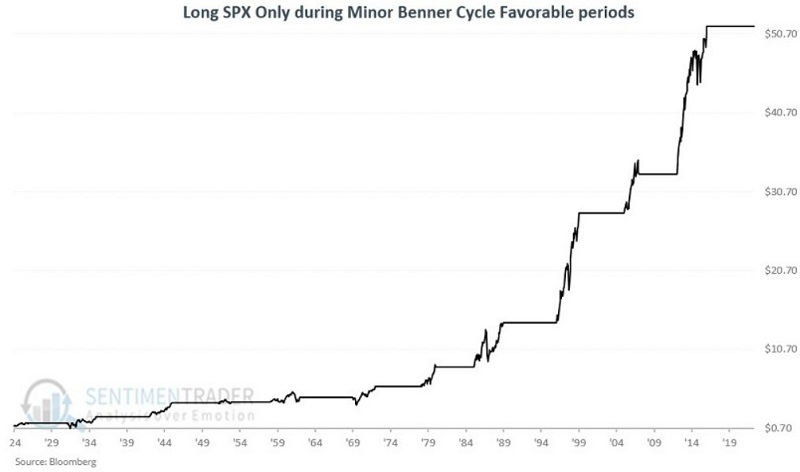
The chart below displays the growth of $1 invested only during the periods listed above.
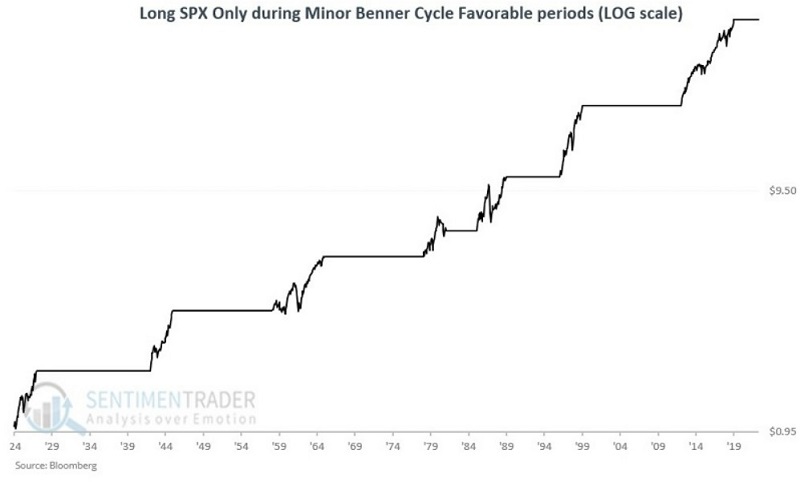
The chart below displays the same results on a logarithmic scale.
The table below displays the cycle-by-cycle results.
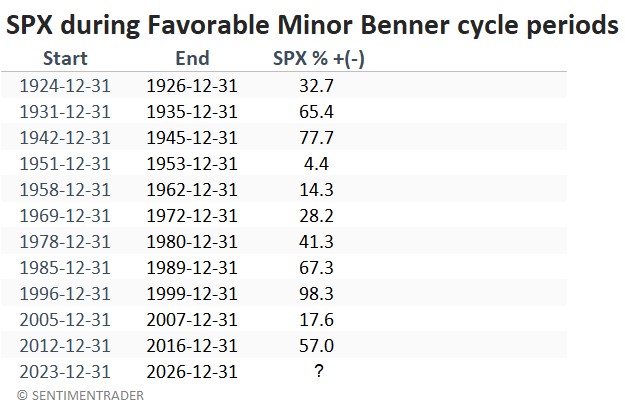
In the past 100 years, overall market performance has been uniformly positive during favorable years in the minor Benner cycle.
Unfavorable years within the minor Benner cycle
The list below contains all the "unfavorable" years the minor Benner cycle indicates.
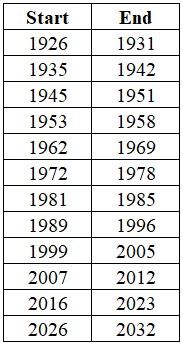
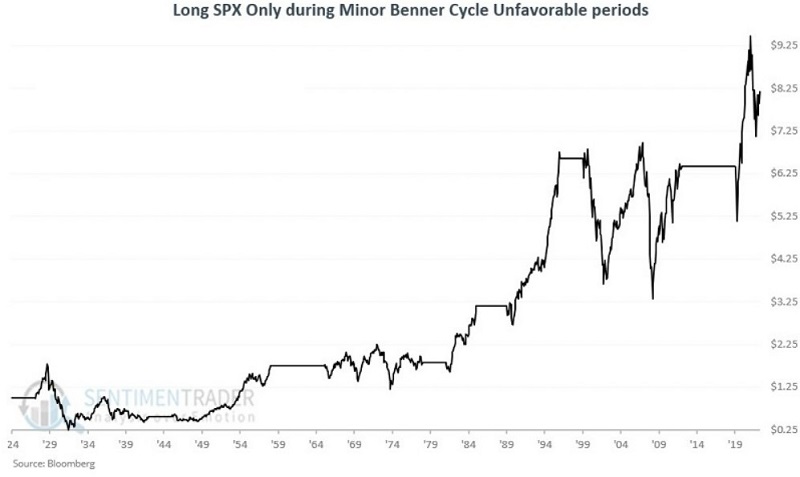
The chart below displays the growth of $1 invested only during the periods listed above.
The table below displays the cycle-by-cycle results.
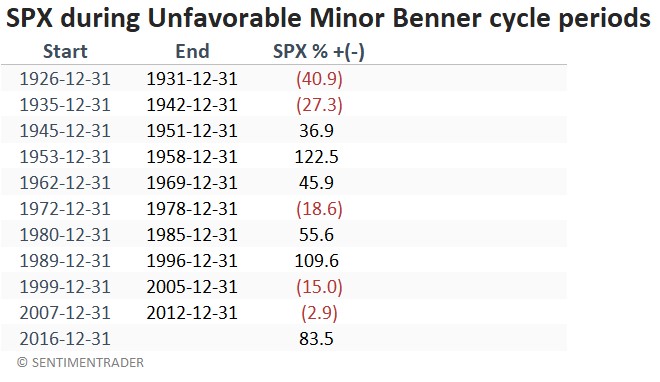
What the research tells us…
The favorable periods within the minor Benner cycle have consistently witnessed favorable action in the stock market. While the start and end dates should not be considered automatic buy and sell dates, the results suggest giving the bullish case the benefit of the doubt during favorable periods within the minor Benner cycle. The next such period beings on 2023-12-31 and extends through 2026-12-31.
Results during unfavorable periods within the minor Benner cycle have been decidedly mixed. Many devastating bear markets (1929-1931, 1966, 1969, 1973-74, 2000-02, and 2008) have occurred within these periods. However, the market has also experienced many significant advances within these periods. Investors should only be concerned about unfavorable periods within the minor Benner cycle if the S&P 500 Index exhibits price weakness.

