
The Bear Market Probability minus Macro Index strategy

Key points:
- The Bear Market Probability minus Macro Index Spread model is currently in extreme territory
- High readings have been bearish for stocks
- This piece will highlight a strategic way to use this indicator as a long-term risk on/risk off tool
The Bear Market Probability minus Macro Index Spread
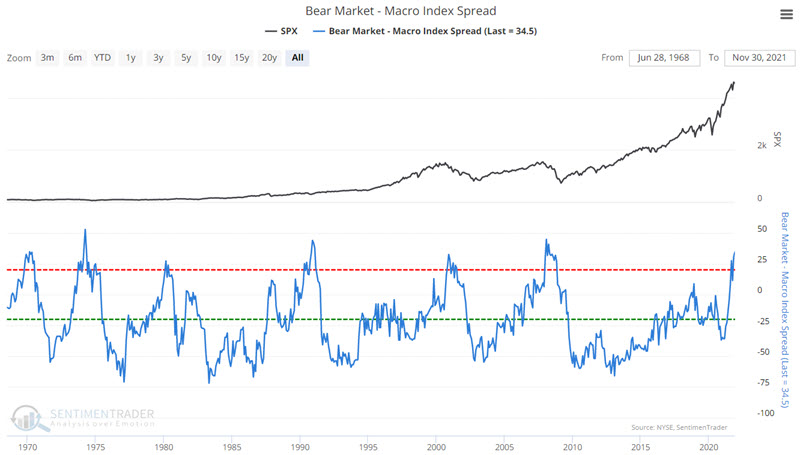
The chart below displays the Bear Market - Macro Index Spread.
This indicator shows the spread between the Bear Market Probability indicator and our Macro Index model. The higher the indicator, the greater the probability of a new bear market, combined with deteriorating fundamental macro conditions, negative for stocks. The lower the indicator, the lower the probability of a significant decline, usually combined with improving macro conditions, which is positive for stocks.
For more background on this highly insightful indicator, you can read this research note from September.
Creating a strategy to identify potential bull markets
We will use one Backtest Engine scan to generate buy signals and another Backtest Engine scan using the same indicator to generate sell signals.
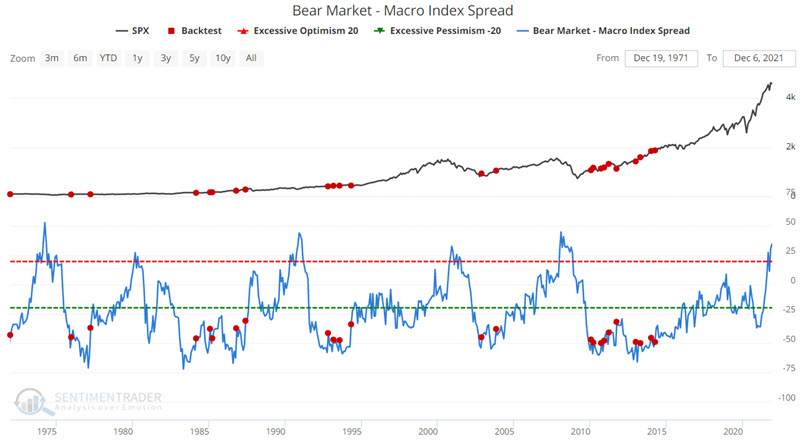
For the buy signal, we first want to see a very washed out, oversold reading (below -50) followed by a reversal back above -50. The goal is not necessarily to attempt to pick the bottom, but rather to avoid trying to catch a falling knife and wait for momentum to swing to the upside.
The chart below displays the buy signals generated when the indicator crossed above -50. You can run this test in the Backtest Engine.
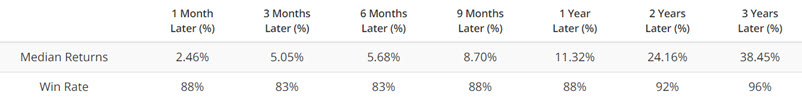
The table below displays a Summary of performance following previous "buy" signals, which showed consistent and impressive gains across all time frames.
And potential bear markets
We want to see the indicator reach a significantly high level for the sell signal. A sell signal occurs when the indicator rises to 20 or higher for this test.
The chart below displays the sell signals generated when the indicator crossed above 20 for the first time in a year. You can run this test in the Backtest Engine.
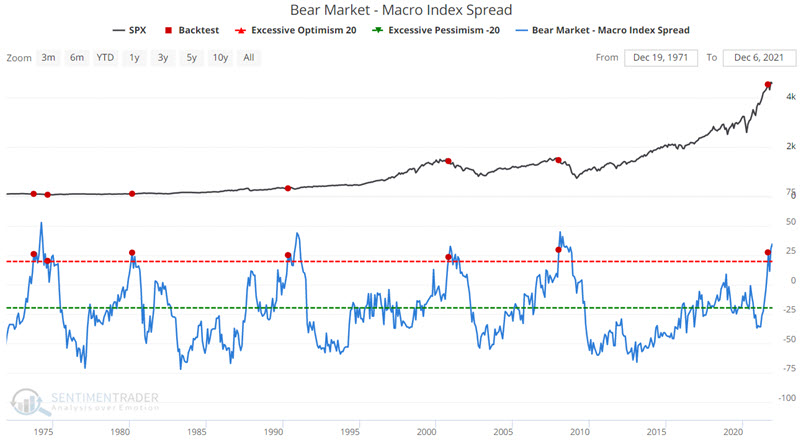
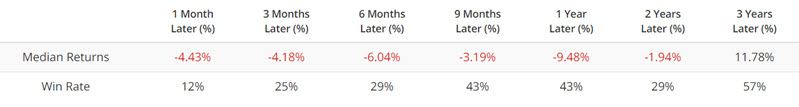
The table below displays a Summary of performance following previous "sell" signals. These show the difficulty that stocks had making headway after similar conditions.
Growing $1 using the model
For testing, we will use the daily closing price for the S&P 500 Index, entering and exiting on the date of each signal.
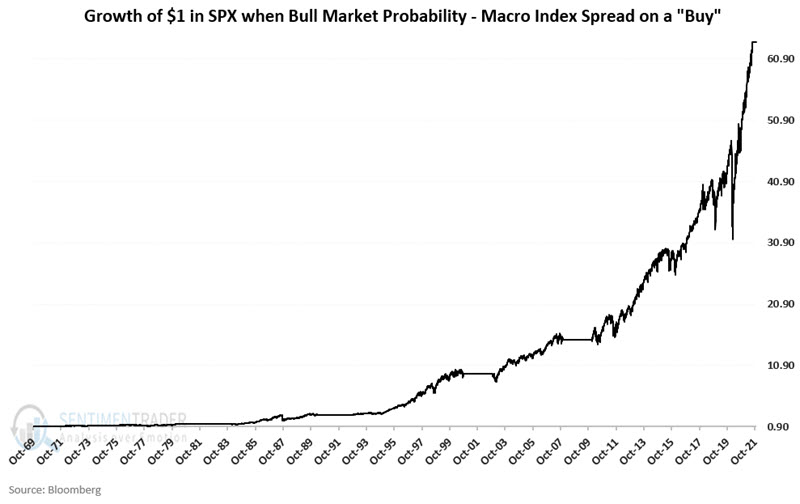
The chart below displays the growth of $1 when the strategy is on a "Buy" signal. $1 grew +6,257% to $63.57 between 10/31/1969 and 12/3/2021.
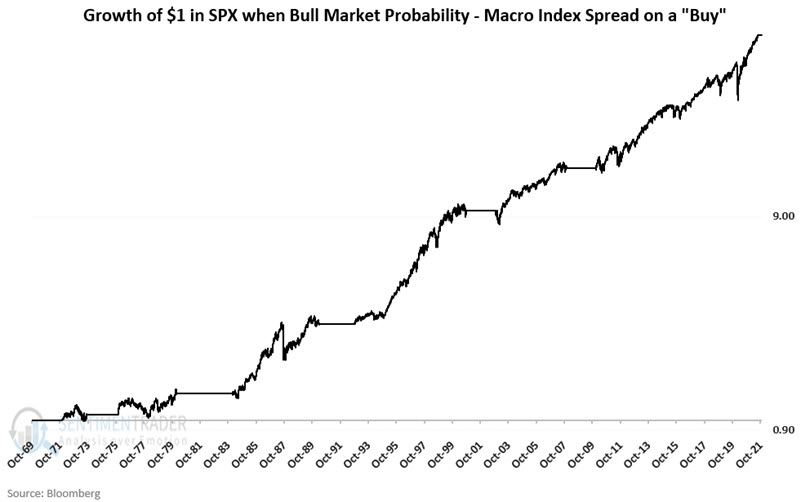
The chart below displays the same data on a logarithmic scale to highlight long-term consistency.
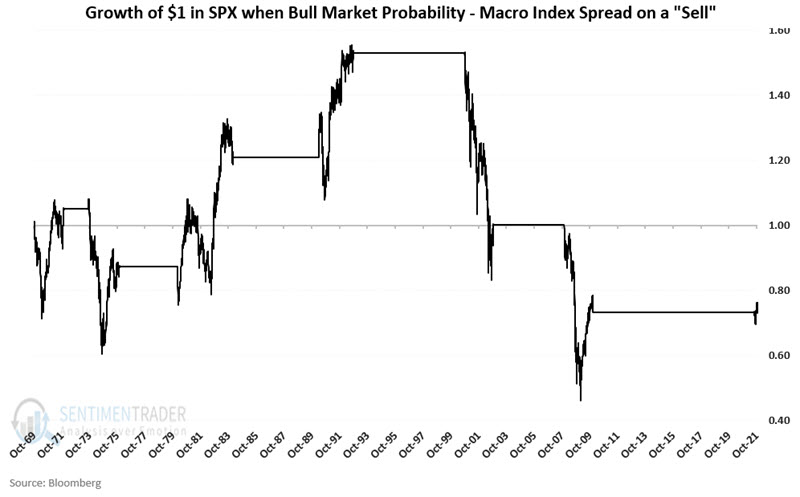
The chart below displays the growth of $1 when the strategy is on a "Sell" signal. $1 declined -26% to $0.74 between 10/31/1969 and 12/3/2021.
The table below displays the price performance of the S&P 500 Index during the bullish periods. Each of the signals was a winner.
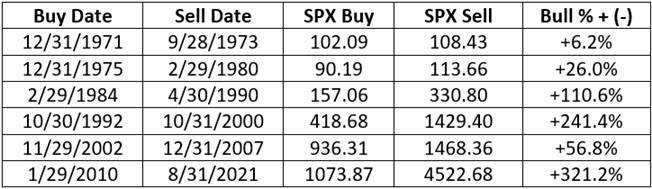
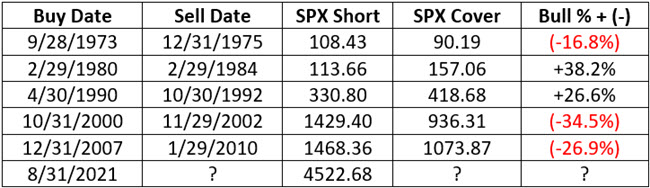
Contrast that to the price performance of the S&P 500 Index during the bearish periods. There were two times the S&P advanced, but it took a while for investors to realize those gains.
What the research tells us…
Over the past 50+ years, the S&P 500 Index has achieved all of its net gain (and more) while this Bear Market Probability minus Macro Index Spread strategy was on a buy signal. While we do not necessarily recommend the use of this as a standalone strategy, as part of a larger "weight of the evidence" approach, this model can offer valuable risk-on/risk-off information. This particular model is presently in "risk-off" mode, so we'll have to see if the recent surge in buying interest and signs of pessimism will be enough to counter some of these contradictory forces.