Data &
Technology
Research
Reports
Report Solutions
Reports Library
Actionable
Strategies
Free
Resources
Simple Backtest Calculator
Simple Seasonality Calculator
The Kelly Criterion Calculator
Sentiment Geo Map
Public Research Reports
Free Webinar
Pricing
Company
About
Meet Our Team
In the News
Testimonials
Client Success Stories
Contact
Log inLoginSign up
< BACK TO ALL REPORTS

The Average Stock Is Dragging the Indexes Lower

Jason Goepfert
2021-07-20
Within days of the S&P 500 sitting at record highs, the NYSE Cumulative Advance/Decline Line fell to a multi-month low.

For months now, and especially since the peak in speculative mania in February, we've watched closely for internal deterioration in the major indexes.

Those signs popped up sporadically, with a day or two of oddly poor breadth readings in the S&P 500 or broader market. But usually, within a couple of days, things would completely reverse and wipe away any divergences.

Not so much this time.

Last week, we saw that the remarkable momentum run in the S&P has come with fewer than 60% of its stocks holding above their 50-day moving averages. That's one of the starkest divergences, over a respectable time frame (not just a single session), since 1928.

All of this internal weakness has bled into broader measures. The Cumulative Advance/Decline Line for the NYSE has now sunk to a multi-month low. 

NYSE cumulative advance decline line

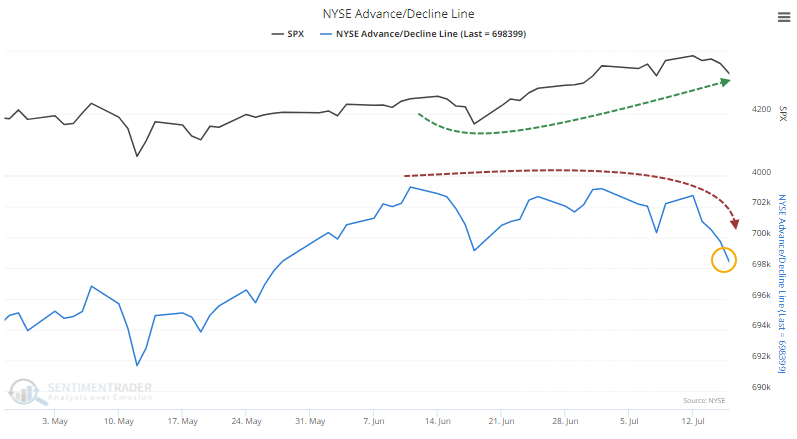
Since the A/D Line peaked on June 11, the S&P 500 has gone on to add more than 100 points and was perched at an all-time high within the past week. The A/D Line, in contrast, has sunk enough to be at its lowest point in two months. 

When this has triggered in the past, the S&P tended to follow the A/D Line lower, with a positive return over the next month only 37% of the time. It showed more risk than reward up to three months later and showed below-random returns across all time frames.


What else we're looking at

  • Full returns in the S&P 500 following a divergence with the advance decline line
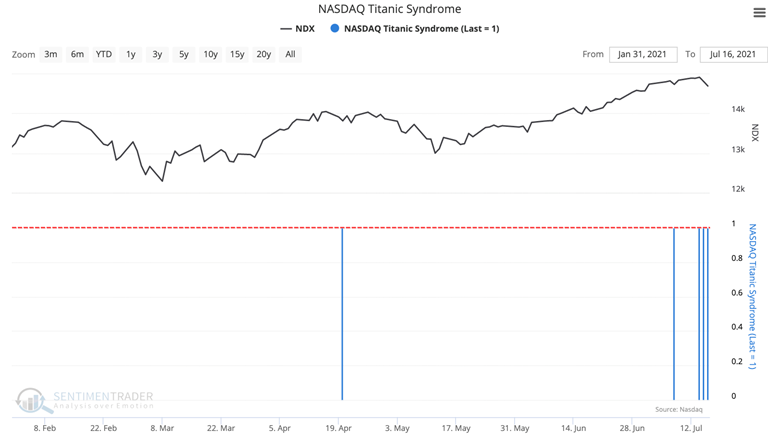
  • The Nasdaq has triggered a Titanic Symdrone warning for 3 straight days - what that meant for returns
  • What happens when there's a breadth divergence in both the NYSE and Nasdaq
  • Potential ways to adjust a previous option position in TLT
  • What happens in copper, gold, gold miners, and Treasuries after an extreme in the Copper / Gold ratio
  • An update on absolute and relative trends in industry, sector, and country ETFs

Stat box

On Monday, the S&P 500 SPDR, SPY, fell to a multi-week low on the highest volume in 90 days. When occurring within 5% of a peak, SPY triggered similar signals 47 times in its history. Over the next three months, SPY rallied after 39 of them.

Etcetera

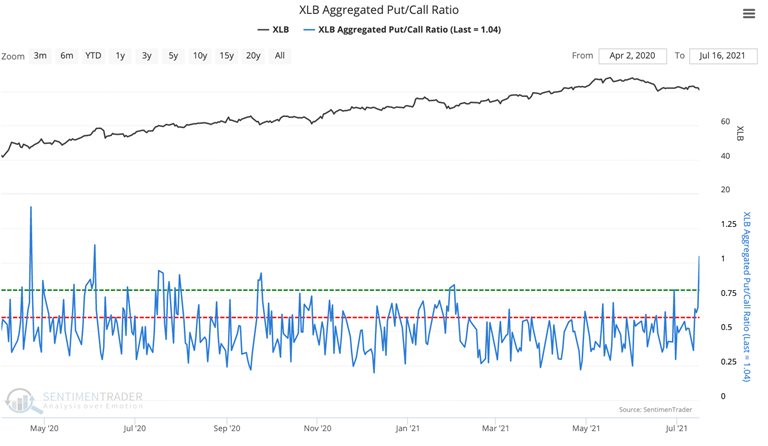
Materialistic. For the first time in over a year, there was more trading activity in put options than call options in Basic Material stocks.

basic materials xlb put call ratio

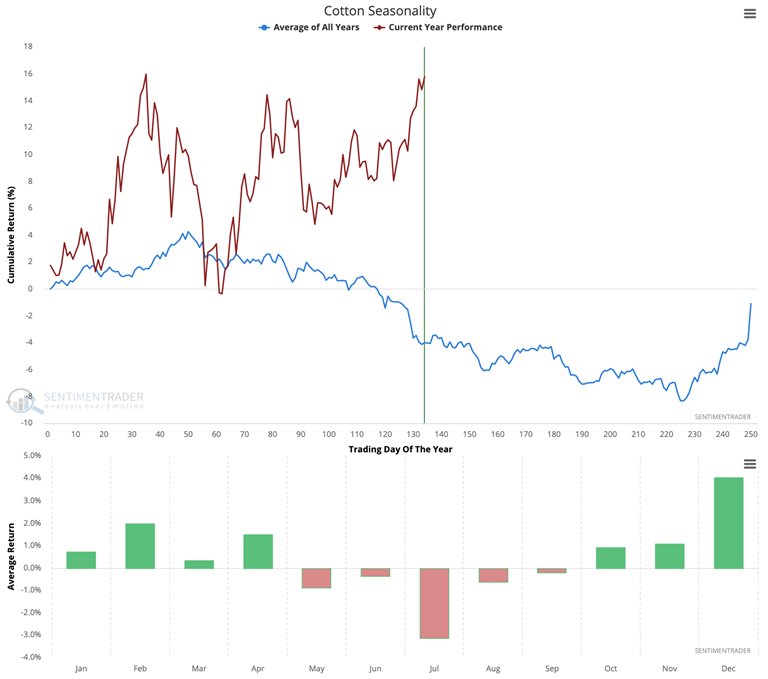
On the contrary. The current year performance of cotton is defying years past. Cotton is typically sluggish from the end of spring to the fall, yet this year it's quite the opposite.

cotton seasonality

Get your lifejacket. The NASDAQ Titanic Syndrome triggered three days in a row. This is the first time the indicator has triggered three days in a row or more since Feb. of 2020.

nasdaq titanic syndrome

DATA &
TECHnologies
IndicatorEdge
‍
BackTestEdge
‍
Other Tools
‍
DataEdge API
RESEARCH
reports
Research Solution
‍
Reports Library
‍
actionable
Strategies
Trading Strategies
‍
Smart Stock Scanner
‍
FREE
RESOUrCES
Simple Backtest
Calculator
Simple Seasonality
Calculator
The Kelly Criterion
Calculator
Sentiment Geo Map
‍
Public Research Reports
‍
Free Webinar
COMPANY
‍
About
‍
Meet our Team
‍
In the News
‍
Testimonials
‍
Client Success Stories
Pricing
Bundle pricing
‍
Announcements
‍
FAQ
© 2024 Sundial Capital Research Inc. All rights reserved.
Setsail Marketing
TermsPrivacyAffiliate Program
Risk Disclosure: Futures and forex trading contains substantial risk and is not for every investor. An investor could potentially lose all or more than the initial investment. Risk capital is money that can be lost without jeopardizing ones’ financial security or life style. Only risk capital should be used for trading and only those with sufficient risk capital should consider trading. Past performance is not necessarily indicative of future results.

Hypothetical Performance Disclosure: Hypothetical performance results have many inherent limitations, some of which are described below. No representation is being made that any account will or is likely to achieve profits or losses similar to those shown; in fact, there are frequently sharp differences between hypothetical performance results and the actual results subsequently achieved by any particular trading program. One of the limitations of hypothetical performance results is that they are generally prepared with the benefit of hindsight. In addition, hypothetical trading does not involve financial risk, and no hypothetical trading record can completely account for the impact of financial risk of actual trading. for example, the ability to withstand losses or to adhere to a particular trading program in spite of trading losses are material points which can also adversely affect actual trading results. There are numerous other factors related to the markets in general or to the implementation of any specific trading program which cannot be fully accounted for in the preparation of hypothetical performance results and all which can adversely affect trading results.

Testimonial Disclosure: Testimonials appearing on this website may not be representative of other clients or customers and is not a guarantee of future performance or success.