Data &
Technology
Research
Reports
Report Solutions
Reports Library
Actionable
Strategies
Free
Resources
Simple Backtest Calculator
Simple Seasonality Calculator
The Kelly Criterion Calculator
Sentiment Geo Map
Public Research Reports
Free Webinar
Pricing
Company
About
Meet Our Team
In the News
Testimonials
Client Success Stories
Contact
Log inLoginSign up
< BACK TO ALL REPORTS

The April Barometer (Part II)

Jay Kaeppel
2021-05-05
Stock market performance during the first four months of the year can offer useful clues regarding the performance of the stock market during the remainder of the year.

In Part I, we highlighted that a bullish month of April has tended to be a positive sign for the rest of the calendar year. Part II will look at how the market has performed during May through December after the stock market shows significant strength during the first full four months of the year. 

THE TEST AND THE BENCHMARK

  • Our test in Part II will identify those times when the S&P 500 Index gained +10% or more (using price only data) during the first four months of the year
  • We will then look at the performance for the S&P 500 Index during the remainder of the year (May through December)
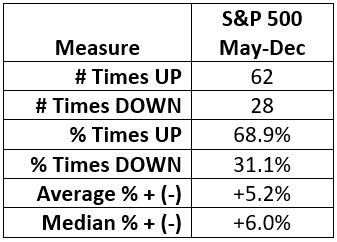
  • First - as a reminder from Part I - let's benchmark how the S&P 500 typically performs from May through December

FIRST FOUR MONTHS OF THE YEAR UP +10% OR MORE

The table below displays only those years since 1931 when the S&P 500 showed a price gain of +10% or more during January through April.  As you can see, only twice did the market show a loss during the last 8 months of the year after the first four months showed a gain of +10% or more.
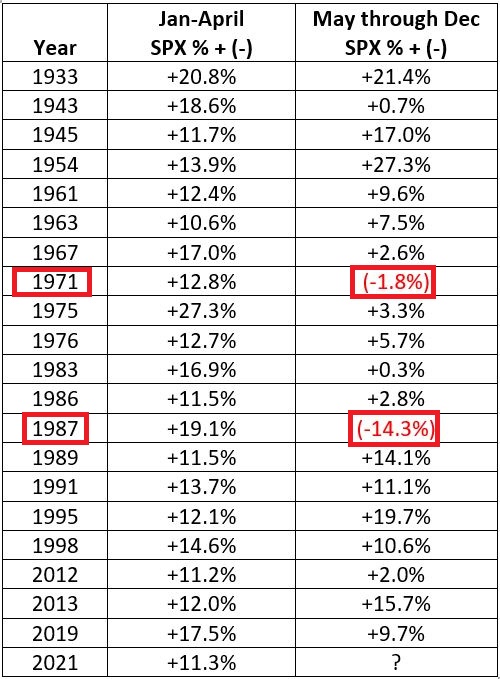
In sum:

  • Up 18 times (90% of the time)
  • Down 2 times (10% of the time)
  • Average May-Dec gain = +10.1%
  • Average May-Dec loss = (-8.1%)
  • Median May-Dec gain = +9.6%
  • Median May-Dec loss = (-8.1%)

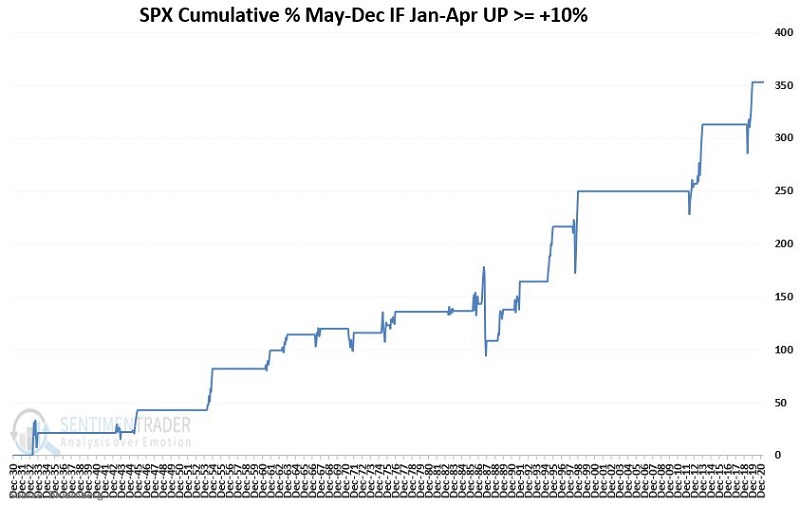
The chart below displays the cumulative price gain for the S&P 500 Index held ONLY during May through December of the years listed in the table above to provide a sense of consistency.

SUMMARY

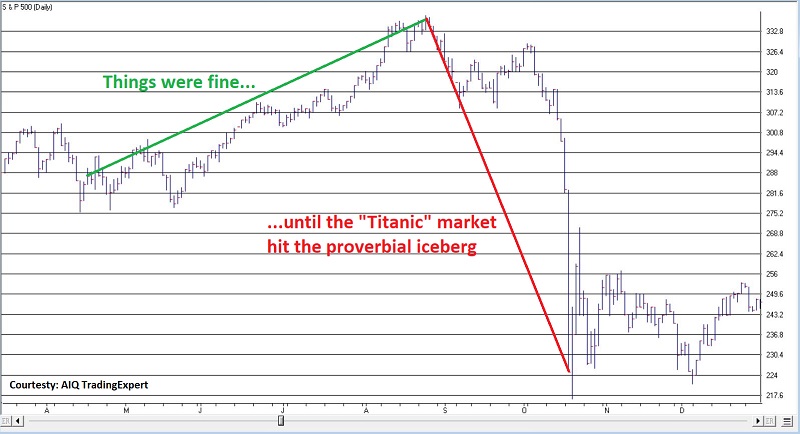
Does the S&P 500 Index rising +11.3% through April 2021 ensure that the rest of 2021 is "smooth sailing" for stocks? Not at all. The chart below displays the performance of the S&P 500 during 1987. 

Note that:

  • everything was smooth sailing until about the middle of August
  • by the close on October 19th, the S&P had declined over 33% from peak-to-valley 
  • the last 8 months of the year witnessed a -14.3% decline for the S&P 500

So, remember this:

  • A strong performance during the first four months of the year lends bullish weight to the overall weight of the evidence
  • But there are never (even in this current runaway bull market) any "sure things" in the market

Sorry, you don't have access to this report

Upgrade your subscription plan to get access
Go to Dasboard
DATA &
TECHnologies
IndicatorEdge
‍
BackTestEdge
‍
Other Tools
‍
DataEdge API
RESEARCH
reports
Research Solution
‍
Reports Library
‍
actionable
Strategies
Trading Strategies
‍
Smart Stock Scanner
‍
FREE
RESOUrCES
Simple Backtest
Calculator
Simple Seasonality
Calculator
The Kelly Criterion
Calculator
Sentiment Geo Map
‍
Public Research Reports
‍
Free Webinar
COMPANY
‍
About
‍
Meet our Team
‍
In the News
‍
Testimonials
‍
Client Success Stories
Pricing
Bundle pricing
‍
Announcements
‍
FAQ
© 2024 Sundial Capital Research Inc. All rights reserved.
Setsail Marketing
TermsPrivacyAffiliate Program
Risk Disclosure: Futures and forex trading contains substantial risk and is not for every investor. An investor could potentially lose all or more than the initial investment. Risk capital is money that can be lost without jeopardizing ones’ financial security or life style. Only risk capital should be used for trading and only those with sufficient risk capital should consider trading. Past performance is not necessarily indicative of future results.

Hypothetical Performance Disclosure: Hypothetical performance results have many inherent limitations, some of which are described below. No representation is being made that any account will or is likely to achieve profits or losses similar to those shown; in fact, there are frequently sharp differences between hypothetical performance results and the actual results subsequently achieved by any particular trading program. One of the limitations of hypothetical performance results is that they are generally prepared with the benefit of hindsight. In addition, hypothetical trading does not involve financial risk, and no hypothetical trading record can completely account for the impact of financial risk of actual trading. for example, the ability to withstand losses or to adhere to a particular trading program in spite of trading losses are material points which can also adversely affect actual trading results. There are numerous other factors related to the markets in general or to the implementation of any specific trading program which cannot be fully accounted for in the preparation of hypothetical performance results and all which can adversely affect trading results.

Testimonial Disclosure: Testimonials appearing on this website may not be representative of other clients or customers and is not a guarantee of future performance or success.