Data &
Technology
Research
Reports
Report Solutions
Reports Library
Actionable
Strategies
Free
Resources
Simple Backtest Calculator
Simple Seasonality Calculator
The Kelly Criterion Calculator
Sentiment Geo Map
Public Research Reports
Free Webinar
Pricing
Company
About
Meet Our Team
In the News
Testimonials
Client Success Stories
Contact
Log inLoginSign up
< BACK TO ALL REPORTS

The aggregated XLE put/call ratio triggered a new buy signal

Dean Christians
2022-01-18
The XLE aggregated put/call ratio increased to a pessimistic level and subsequently reversed lower, triggering a buy signal for energy stocks with a 100% win rate.

Key points:

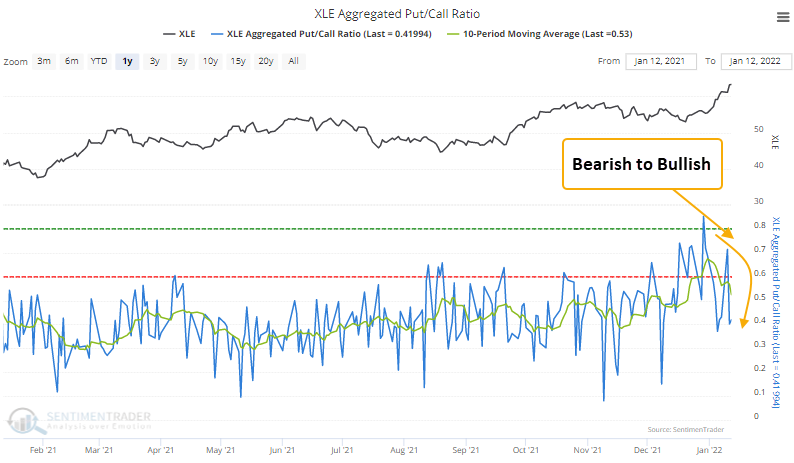
  • XLE constituent put volume increased relative to call volume
  • The aggregated XLE put/call ratio has now reversed lower from an elevated level
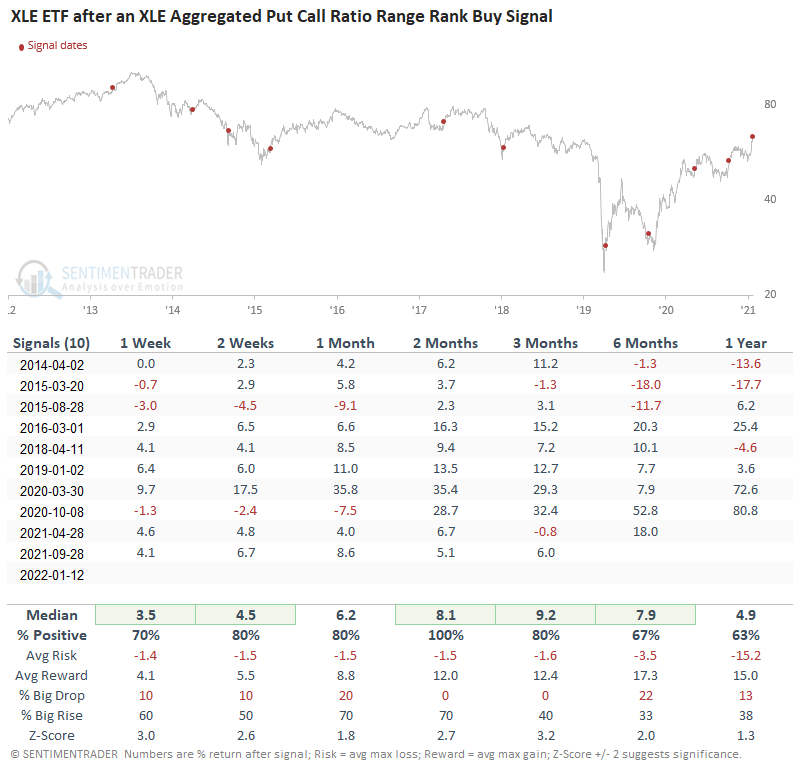
  • Energy stocks have rallied 100% of the time 2 months later after other signals

The aggregated put-call ratio as a contrary sentiment indicator

When investors are bullish on stocks, they buy call options to bet on rising prices. Conversely, when they are bearish on stocks, they purchase put options to bet on declining stocks. The put/call ratio can be used as a contrary indicator to identify an environment where sentiment has become too pessimistic on the future direction of stocks. When opinions become too bearish, stocks tend to rally.

The aggregated put/call ratio indicator measures the summed options data for constituents of the index/ETF. 

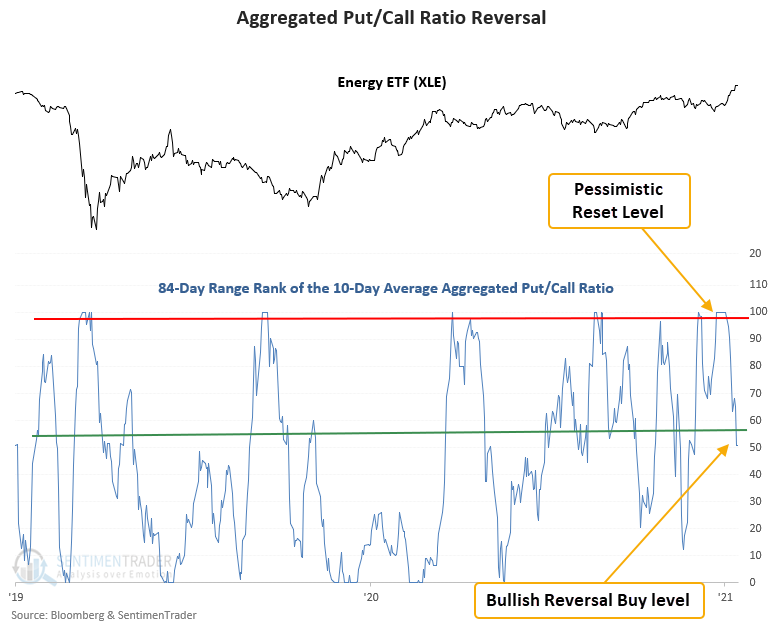
A trading model that identifies a reversal in the aggregated put/call ratio

The put/call ratio trading model applies an 84-day range rank to a 10-day moving average of the XLE aggregated put/call ratio. The pessimistic reset condition is confirmed when the range rank indicator crosses the 99th percentile. A new buy signal occurs when the range rank crosses back below the 57th percentile. At the same time, the 5-day rate of change for the XLE ETF must be >= 3%. i.e., market momentum is positive.

Similar reversals in the put/call ratio have preceded gains 100% of the time

This signal has triggered 10 other times over the past 8 years. After the others, XLE future returns, win rates, and z-scores were excellent across all time frames, especially the 2-month window. The aggregated ETF put and call volume data are new time series with a start date in 2013. Therefore, the sample size is small.

I've highlighted several bullish signals for the energy sector since 1/5/22. So, I would use this signal as additional confirmation of a bullish trend for energy stocks.

What the research tells us...

When put volume increases relative to call volume, traders have become too pessimistic on the outlook for stocks. Stocks are likely to reverse higher when the pessimistic extreme reverses. Similar setups to what we're seeing now have preceded rising prices for the energy sector ETF (XLE), with a 2-month win rate of 100%.

DATA &
TECHnologies
IndicatorEdge
‍
BackTestEdge
‍
Other Tools
‍
DataEdge API
RESEARCH
reports
Research Solution
‍
Reports Library
‍
actionable
Strategies
Trading Strategies
‍
Smart Stock Scanner
‍
FREE
RESOUrCES
Simple Backtest
Calculator
Simple Seasonality
Calculator
The Kelly Criterion
Calculator
Sentiment Geo Map
‍
Public Research Reports
‍
Free Webinar
COMPANY
‍
About
‍
Meet our Team
‍
In the News
‍
Testimonials
‍
Client Success Stories
Pricing
Bundle pricing
‍
Announcements
‍
FAQ
© 2024 Sundial Capital Research Inc. All rights reserved.
Setsail Marketing
TermsPrivacyAffiliate Program
Risk Disclosure: Futures and forex trading contains substantial risk and is not for every investor. An investor could potentially lose all or more than the initial investment. Risk capital is money that can be lost without jeopardizing ones’ financial security or life style. Only risk capital should be used for trading and only those with sufficient risk capital should consider trading. Past performance is not necessarily indicative of future results.

Hypothetical Performance Disclosure: Hypothetical performance results have many inherent limitations, some of which are described below. No representation is being made that any account will or is likely to achieve profits or losses similar to those shown; in fact, there are frequently sharp differences between hypothetical performance results and the actual results subsequently achieved by any particular trading program. One of the limitations of hypothetical performance results is that they are generally prepared with the benefit of hindsight. In addition, hypothetical trading does not involve financial risk, and no hypothetical trading record can completely account for the impact of financial risk of actual trading. for example, the ability to withstand losses or to adhere to a particular trading program in spite of trading losses are material points which can also adversely affect actual trading results. There are numerous other factors related to the markets in general or to the implementation of any specific trading program which cannot be fully accounted for in the preparation of hypothetical performance results and all which can adversely affect trading results.

Testimonial Disclosure: Testimonials appearing on this website may not be representative of other clients or customers and is not a guarantee of future performance or success.