Data &
Technology
Research
Reports
Report Solutions
Reports Library
Actionable
Strategies
Free
Resources
Simple Backtest Calculator
Simple Seasonality Calculator
The Kelly Criterion Calculator
Sentiment Geo Map
Public Research Reports
Free Webinar
Pricing
Company
About
Meet Our Team
In the News
Testimonials
Client Success Stories
Contact
Log inLoginSign up
< BACK TO ALL REPORTS

The 4th Longest Momentum Streak Since 1928 Just Ended

Jason Goepfert
2021-09-15
For the first time in 10 months, fewer than 75% of stocks in the S&P 500 are traded above their 200-day moving averages.

It was quite a run, but the dip in stocks last week did a bit of damage.

We've seen from multiple perspectives just how much of an outlier 2021 has been in terms of sentiment, breadth, and momentum. At various points since January, momentum ebbed, or negative breadth divergences triggered, then buyers came in immediately.

Yet, at no time did fewer than 75% of S&P stocks close below their long-term averages until the end of last week. For the first time in 10 months, fewer than 3 out of every 4 stocks in the S&P 500 closed above their 200-day moving averages.

That ends the 4th-longest streak since at least 1928.

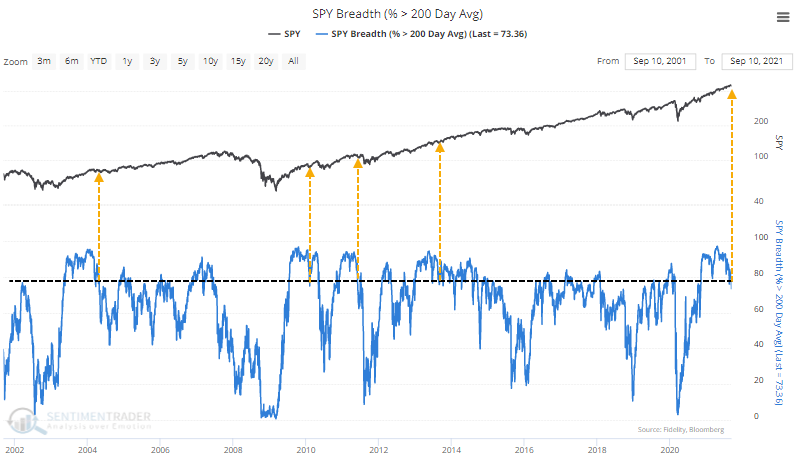
In over 90 years of history, there have only been 5 other streaks of at least 200 consecutive days. Like we see with many momentum types of data, forward returns were good, even after the streaks ended. While it did precede a big dip in 1950, the others saw minimal losses or gains over the following months.


What else we're looking at

  • Returns following the ends of long streaks of more than 75% of stocks trading above their 200-day averages
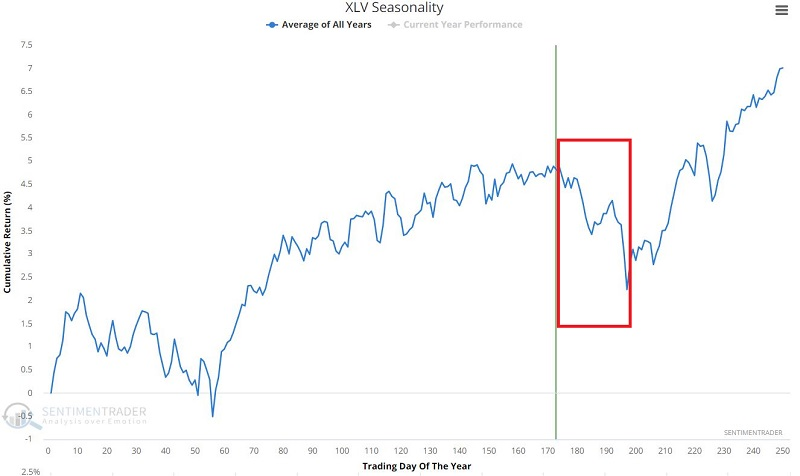
  • A look at the near-term window for Health Care stocks
  • A trading system using the Medium-Term Optimism Index

Stat box

The S&P 500 index has closed below its open for the 6th consecutive trading day. That ties it for the longest such streak of intraday selling pressure in over 2 years, with February 27, 2020 being the other.

Etcetera

Seasonal window is shut. The annual seasonal pattern in the XLF health care fund shows that it has typically peaked in mid-September, with weakness lasting for about the next 30 trading days.

xlv health care seasonality

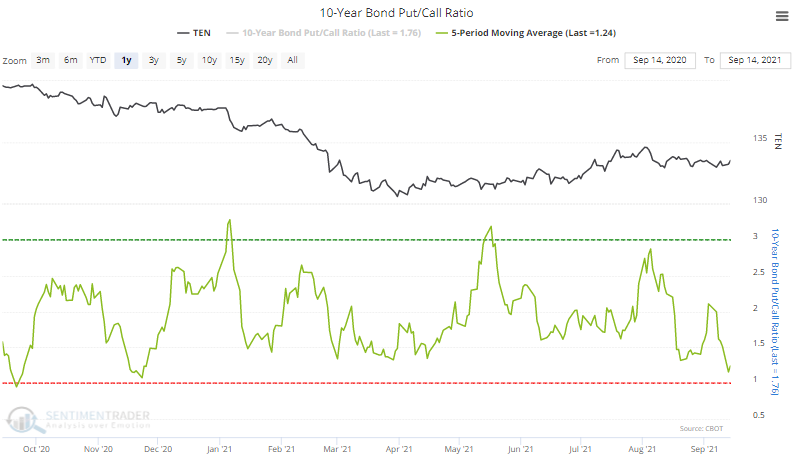
A bond put-down. Over the past 5 days, the put/call ratio on 10-year Treasury note futures has dropped toward 1, meaning traders nearly traded as many call options as put options. That's nearing the lowest level in a year.

10 year treasury note put call ratio

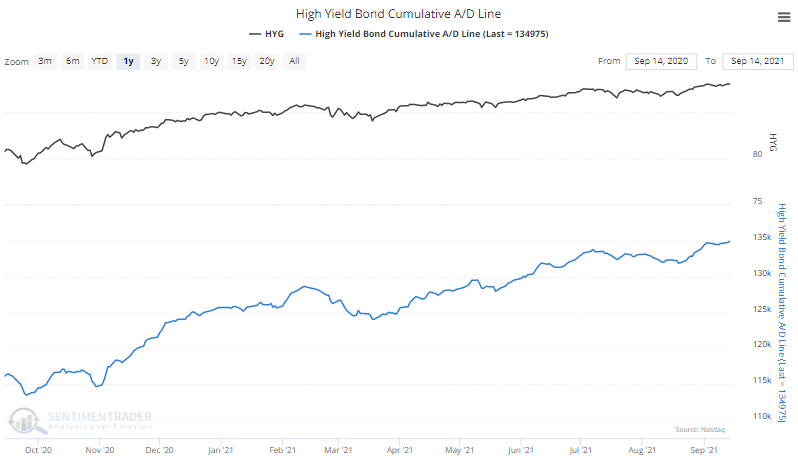
Corporate bonds a-ok. Among high-yield bonds, the cumulative advance/decline line just reached a new high, showing no distress under the surface in this market.

high yield junk bond advance decline line

DATA &
TECHnologies
IndicatorEdge
‍
BackTestEdge
‍
Other Tools
‍
DataEdge API
RESEARCH
reports
Research Solution
‍
Reports Library
‍
actionable
Strategies
Trading Strategies
‍
Smart Stock Scanner
‍
FREE
RESOUrCES
Simple Backtest
Calculator
Simple Seasonality
Calculator
The Kelly Criterion
Calculator
Sentiment Geo Map
‍
Public Research Reports
‍
Free Webinar
COMPANY
‍
About
‍
Meet our Team
‍
In the News
‍
Testimonials
‍
Client Success Stories
Pricing
Bundle pricing
‍
Announcements
‍
FAQ
© 2024 Sundial Capital Research Inc. All rights reserved.
Setsail Marketing
TermsPrivacyAffiliate Program
Risk Disclosure: Futures and forex trading contains substantial risk and is not for every investor. An investor could potentially lose all or more than the initial investment. Risk capital is money that can be lost without jeopardizing ones’ financial security or life style. Only risk capital should be used for trading and only those with sufficient risk capital should consider trading. Past performance is not necessarily indicative of future results.

Hypothetical Performance Disclosure: Hypothetical performance results have many inherent limitations, some of which are described below. No representation is being made that any account will or is likely to achieve profits or losses similar to those shown; in fact, there are frequently sharp differences between hypothetical performance results and the actual results subsequently achieved by any particular trading program. One of the limitations of hypothetical performance results is that they are generally prepared with the benefit of hindsight. In addition, hypothetical trading does not involve financial risk, and no hypothetical trading record can completely account for the impact of financial risk of actual trading. for example, the ability to withstand losses or to adhere to a particular trading program in spite of trading losses are material points which can also adversely affect actual trading results. There are numerous other factors related to the markets in general or to the implementation of any specific trading program which cannot be fully accounted for in the preparation of hypothetical performance results and all which can adversely affect trading results.

Testimonial Disclosure: Testimonials appearing on this website may not be representative of other clients or customers and is not a guarantee of future performance or success.