
The 20-Year Cycle (Part II)

This is Part II of a three-part series regarding the 20-year cycle in the stock market.
Part I of this series contained "The Bad News", i.e., that the first 30 months of each decade that has started with a Presidential Election Cycle (i.e., 1900, 1920, 1940, etc.) has seen the Dow Jones Industrial Average decline in each case. The good news is that so far the market is bucking this trend, with the Dow above its close of 12/31/2019.
There is more "Good News" that typically unfolds as the decade progresses. Shortly after the "Bad News" period within the 20-year cycle ends, a favorable 42-month period begins/
The 20-Year Pattern - Part II
Part II of our 20-year pattern starts on September 30th, 1902. From this date we will look at the next 42 months as a seasonally "favorable" period. Then we will progress in 20-year intervals. In other words:
- Sep 30, 1902 to Mar 31, 1906
- Sep 30, 1922 to Mar 31, 1926
- Sep 30, 1942 to Mar 31, 1946
- Sep 30, 1962 to Mar 31, 1966
- Sep 30, 1982 to Mar 31, 1986
- Sep 30, 2002 to Mar 31, 2006
- Etc.
The Historical Record
Let's start with the conclusion which is displayed in Figure 1 using monthly closing price data for the Dow Jones Industrial Average.
- The first two columns show the start and end dates.
- The third column shows the cumulative price change for the Dow for the full 42-month period.
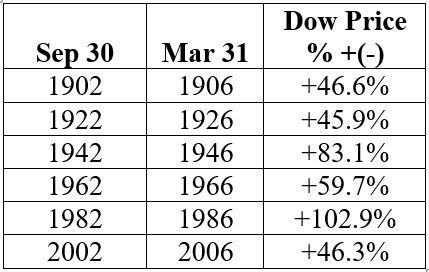
Figure 1 - Dow price % +(-) during 1st 42-month favorable period (every other decade); 1899-2019
Some things to note:
- Most importantly, note that ALL 6 of these periods showed a significant price gain.
- The average net performance for the Dow during this recurring 42-month period was a gain of +64.1%
Figure 2 displays the cumulative results of buying and holding the Dow ONLY from Sep 30th of "even" year 2 through Mar 31st of "even" year 6, from 1899 to the present.
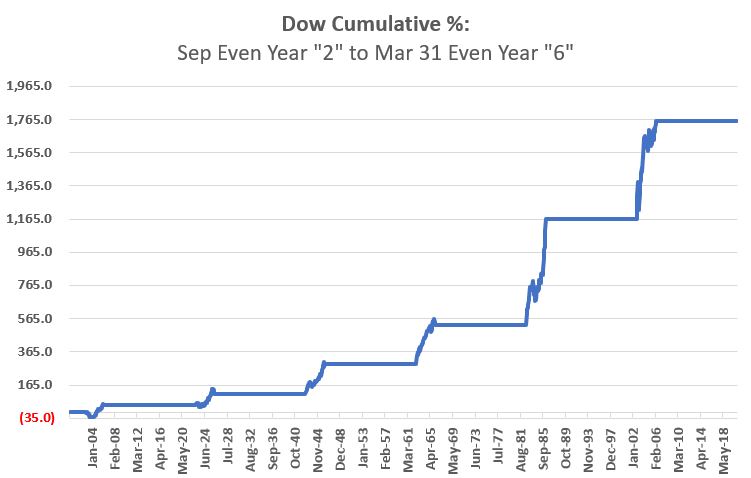 Figure 2 - Cumulative Dow Price performance during 42-month favorable period - every other decade (1899-2019)
- The cumulative result through 12/31/2019 is a gain of +1,756%
Figures 3 through 8 display each period listed in Figure 1 individually
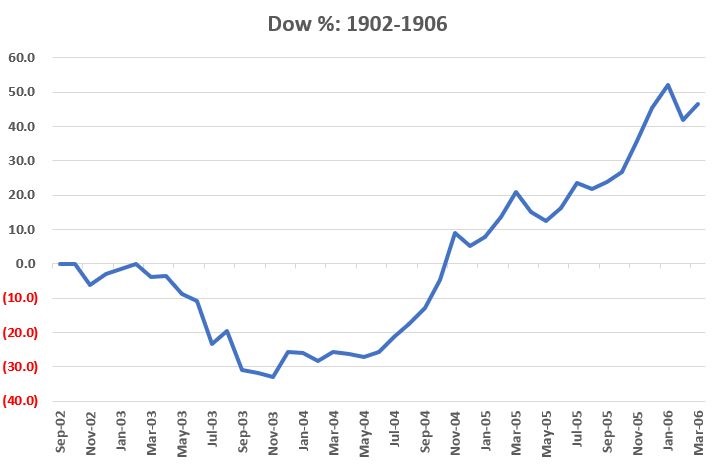 Figure 3 - Dow % +(-) Sep 1902-Mar 1906
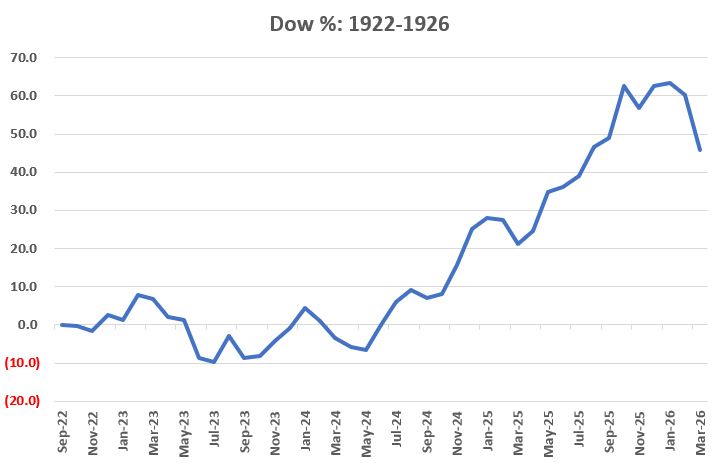 Figure 4 - Dow % +(-) Sep 1922-Mar 1926
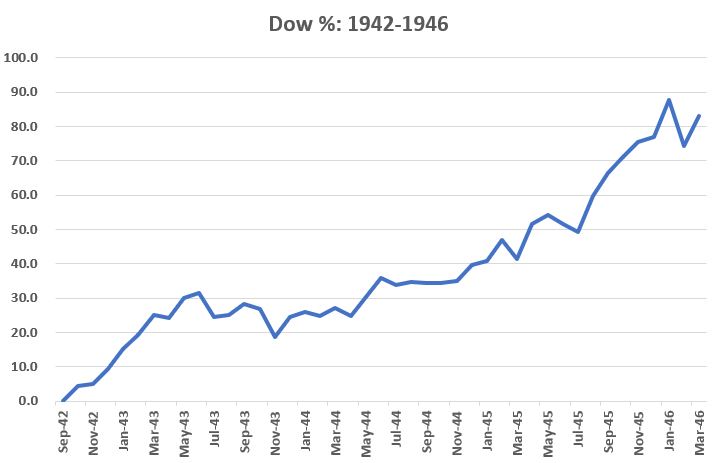 Figure 5 - Dow % +(-) Sep 1942-Mar 1946
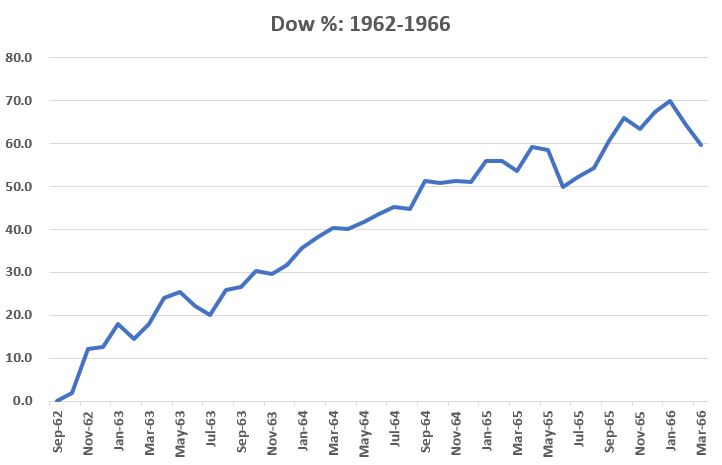 Figure 6 - Dow % +(-) Sep 1962-Mar 1966
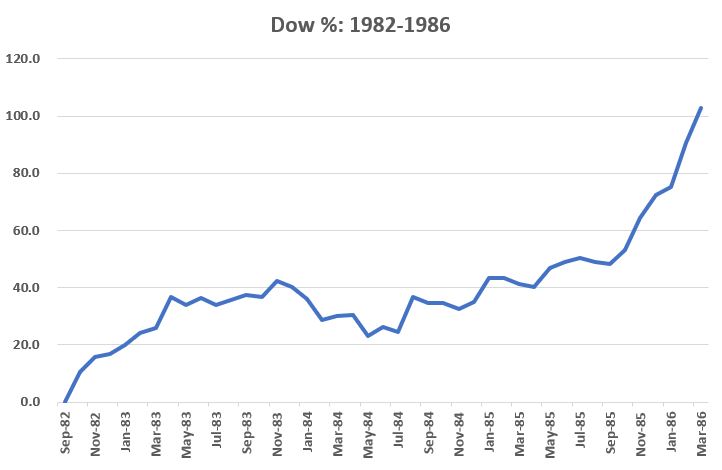 Figure 7 - Dow % +(-) Sep 1982-Mar 1986
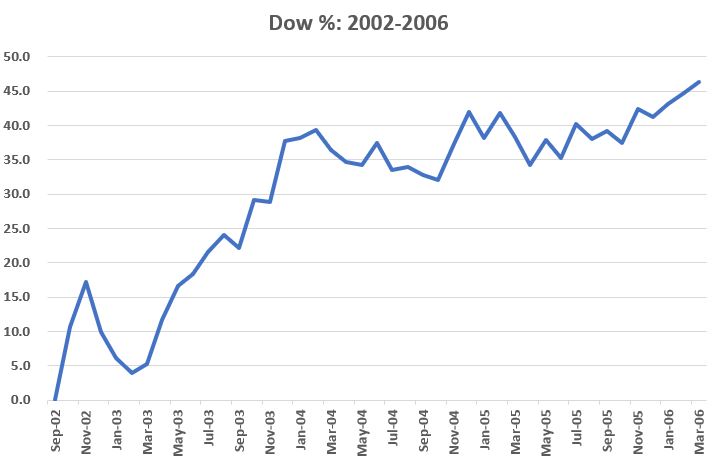 Figure 8 - Dow % +(-) Sep 2002-Mar 2006
Summary
Will the period from September 30, 2022 through March 31, 2026 witness a significant price gain by the Dow Jones Industrial Average?
Well, that is the question isn't it? At the very least, history seems to suggests that investors should give the bullish case every benefit of the doubt during this time period.