
The 20-Year Cycle (Part I)

This is Part I of a three-part series regarding the 20-year cycle in the stock market.
Not every idea you come across in the markets is useful as - or even intended to be - a standalone strategy, generating specific buy and sell signals on a timely manner. Some provide "perspective", and when combined with other indicators can be quite powerful.
A major component to success in the markets is getting in tune - and staying in tune - with the dominant trends. Make no mistake, there are traders who thrive as counter-trend traders. But for many (most?) riding the dominant trend is a much easier course than trying to decide when a turn of the tide is imminent.
Seasonal trends often fit into this perspective category. While there are many such trends that have proven to be quite accurate, in general seasonal trends tell you what a market "should be doing", and not necessarily what it "will be doing." Probably the best way to say it is to state that:
- Seasonality "is climate, not weather." (original source: Michael Santoli)
Seasonality can often tell you "what you should be looking for" and can be combined with other indicators or trend-following methods to paint a very useful picture. For example, if a given seasonal trend says a given market "should" be bullish during a certain time period AND within that period your trend-following method "is" bullish, that is can be a simple, yet very powerful combination that can help an investor to ride a big winner.
All that being said, the reality remains that it does require something of a leap of faith to risk one's hard-earned money based on something that happened in the past and the hope that it will repeat again in the future. For the record, I am OK with not a lot of people putting much faith in these things. Personally, I refer to it as "finding an edge" in the market where most people never look.
For openers, let's look at one aspect of the 20-year cycle in the stock market.
The 20-Year Pattern - Part 1
Part 1 of our 20-year pattern starts on December 31st, 1899. From this date we will look at the first 30 months of the new decade, i.e., through June of the Year ending in "2" - in this case June 30, 1902.
Then we will progress in 20-year intervals. In actuality, what we are examining is the first 30 months of each decade that begins with a presidential election year (i.e., 1900, 1920, 1940, etc.). So next we will look at Dec 31, 1919 through June 30, 2022, and then onto 1939 to 1942, 1959 to 1962, 1979 to 1982, and finally 1999 to 2002. In other words:
- Dec 31, 1899 to Jun 30, 1902
- Dec 31, 1919 to Jun 30, 1922
- Dec 31, 1939 to Jun 30, 1942
- Dec 31, 1959 to Jun 30, 1962
- Dec 31, 1979 to Jun 30, 1982
- Dec 31, 1999 to Jun 30, 2002
- Dec 31, 2019 to Jun 30, 2022
- Etc.
The Historical Record
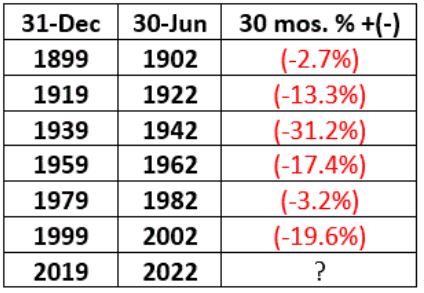
Let's start with the conclusion which is displayed in Figure 1 using monthly closing price data for the Dow Jones Industrial Average.
- The first two columns show the start and end dates.
- The third column (titled 30 mos. % +(-)), shows the cumulative price change for the Dow for the first 2.5 years of the decade.
Figure 1 - Dow price % +(-) during 1st 30 months of decade (every other decade); 1899-2019
Some things to note:
- Most importantly, note that ALL 6 of the decade-opening 30-month periods showed a net loss.
- The average net performance for the Dow during this recurring 30-month period was a loss of -14.6%
Figure 2 displays the cumulative results of buying and holding the Dow ONLY from Dec 31st of "odd" year 9 through June 30th of "even" year 2, from 1899 to the present.
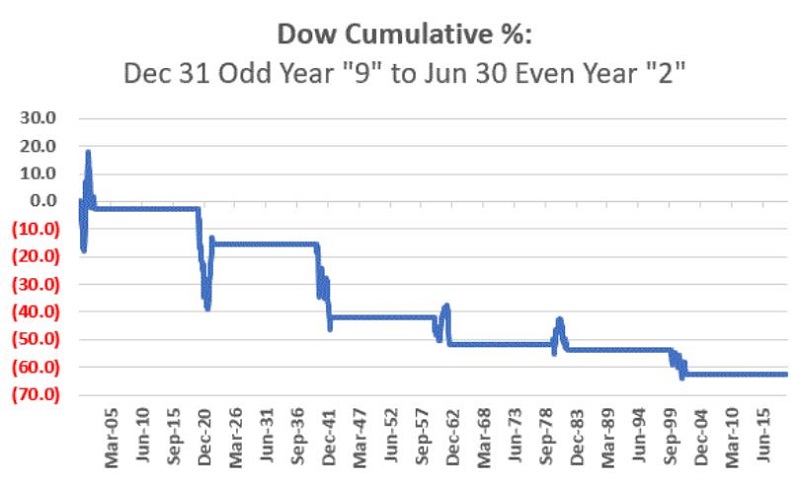 Figure 2 - Cumulative Dow Price performance during 1st 30-months of decade - every other decade (1899-2019)
*The cumulative result through 12/31/2019 is a loss of -62.7%
Figures 3 through 8 display each period listed in Figure 1 individually
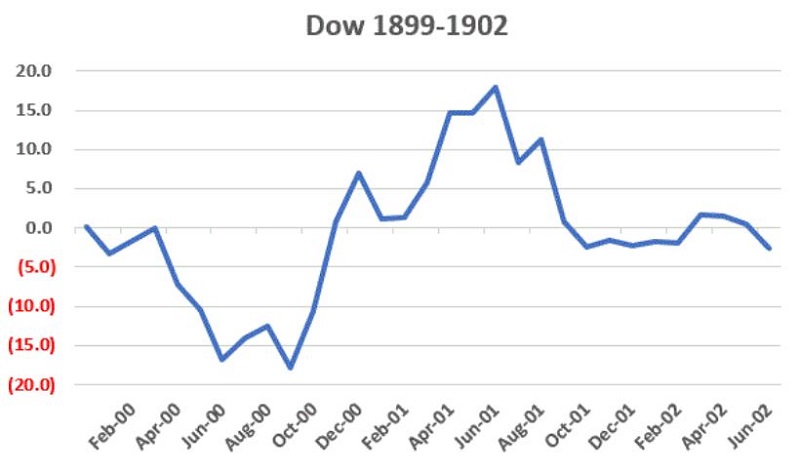 Figure 3 - Dow % +(-) Dec 1899-Jun 1902
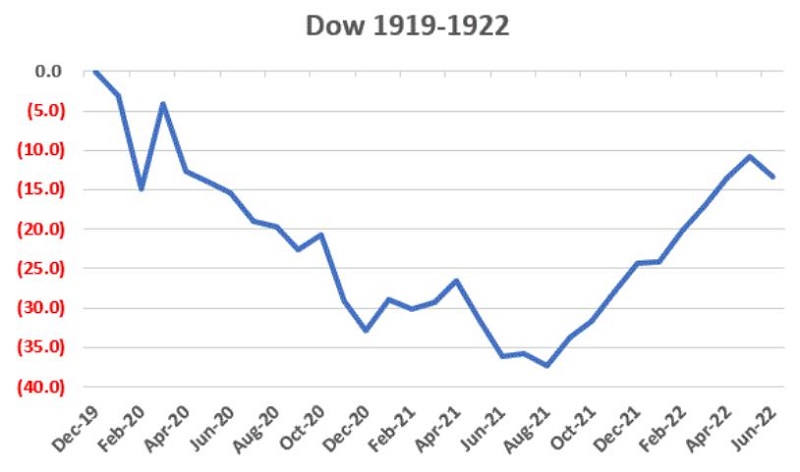 Figure 4 - Dow % +(-) Dec 1919-Jun 1922
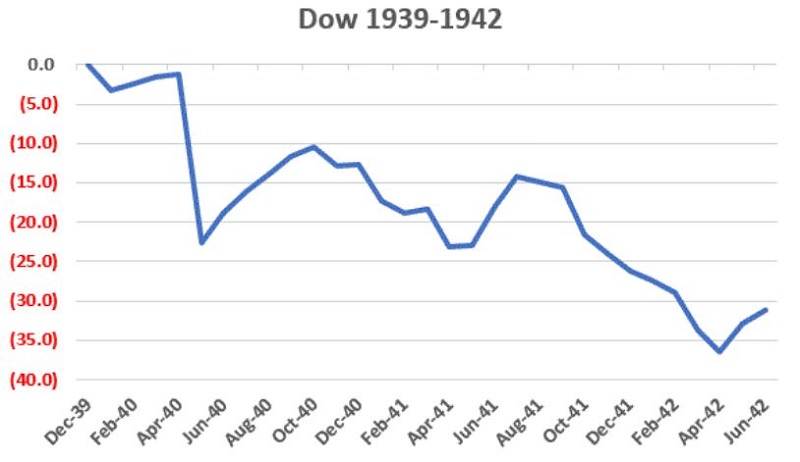 Figure 5 - Dow % +(-) Dec 1939-Jun 1942
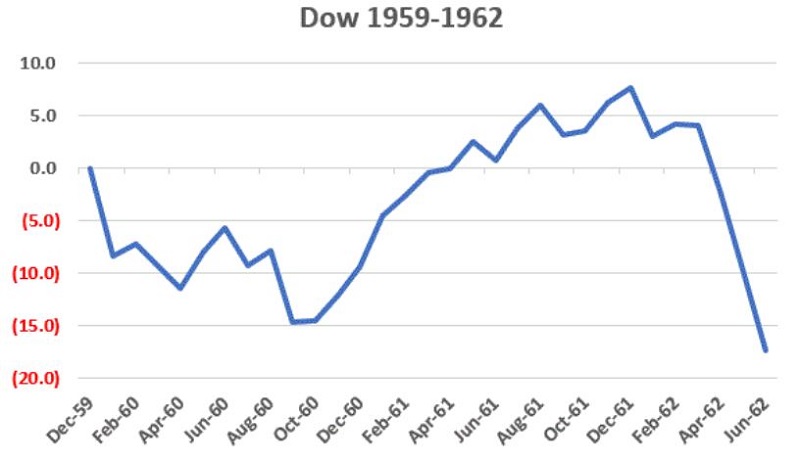 Figure 6 - Dow % +(-) Dec 1959-Jun 1962
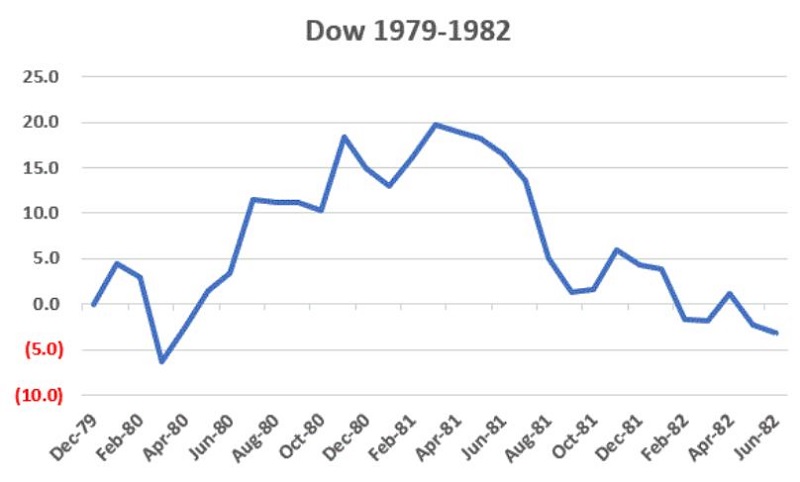 Figure 7 - Dow % +(-) Dec 1979-Jun 1982
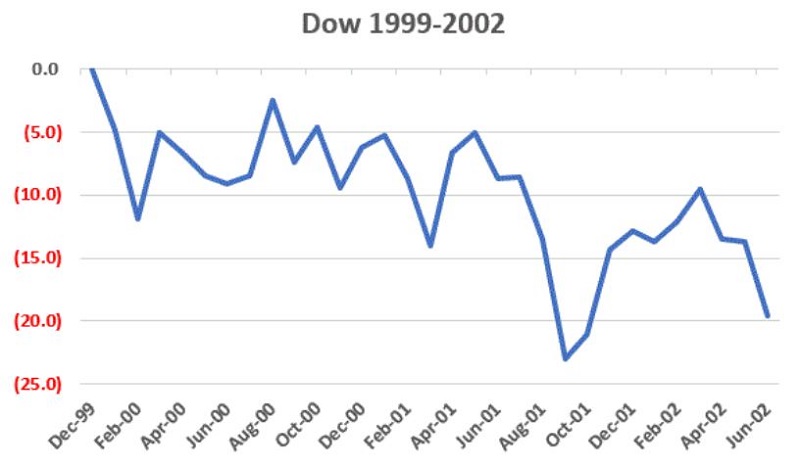 Figure 8 - Dow % +(-) Dec 1999-Jun 2002
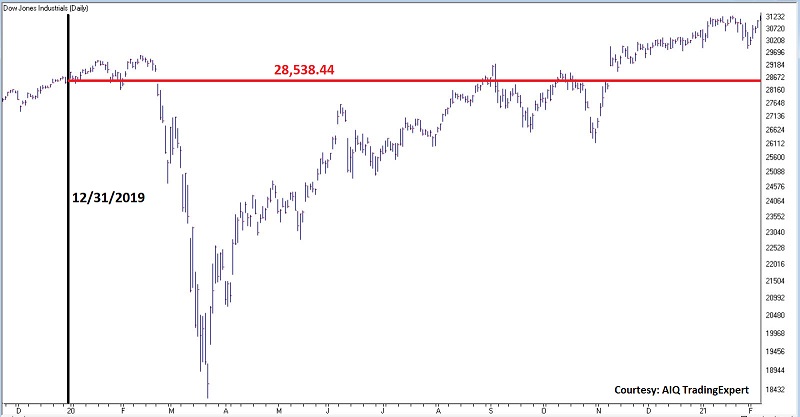
Now let's look at where things stand currently The latest "cycle" began at the close on 12/31/2019. Since that time, the Dow Jones Industrial Average is up +9.1% (price performance only). So, between now and 6/30/2022 (roughly 16.5 months from now) one of two things will happen:
- This cycle will be "broken", i.e., the Dow will close above 28,538.44 on 6/30/2022, OR
- The cycle will remain in intact, which implies that the Dow will lose at least -9.1% between now and then in order to close back below it's 12/31/2019 price level of 28,538.44
Summary
So, what do we do now? Do we dismiss this 20-year pattern and state that what happened 20 or 40 or 60 years ago doesn't matter a whit? Or do we cue the scary music?
As always, only time will tell. The current price trend is bullish and a blow-off type rally remains a distinct possibility. Still, this particular seasonal trend serves as a reminder that the current level of rampant speculation that Jason has highlighted in abundance of late, and the overvalued level of the market (Shiller P/E, Buffet Market Cap-to-GDP ratio, etc.) should NOT be ignored. Which all leads nicely to:
Jay's Trading Maxim #42: If you are walking down the sidewalk and trip and fall, that's one thing. If you are climbing a mountain and you trip and fall, that is something else. And if you are, a) climbing a mountain, b) not aware that you are climbing a mountain, and, c) staring at the sky and trip and fall, there is a lot of, ahem, "potential downside."
Enjoy the trend for as long as it lasts. But be sure to locate the exit nearest you before settling in.