
The 10-year yield recaptures a perfect trend score

Key points:
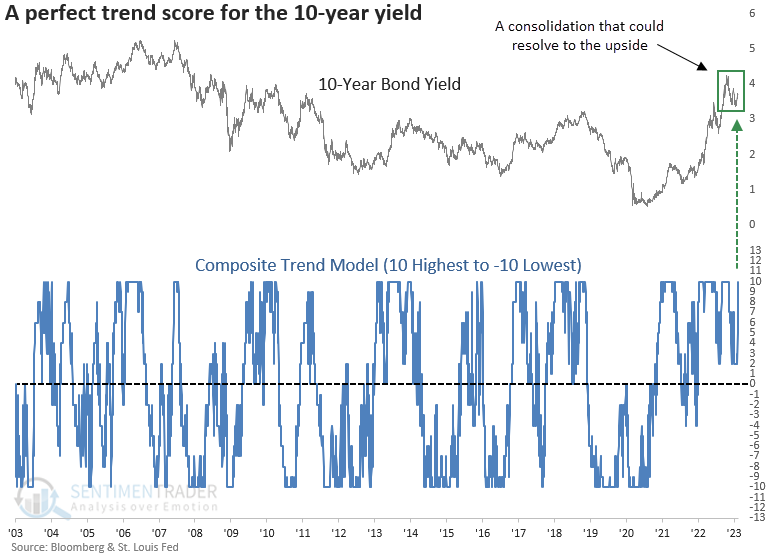
- A composite that measures the trend strength for the 10-year yield surged to the highest level possible
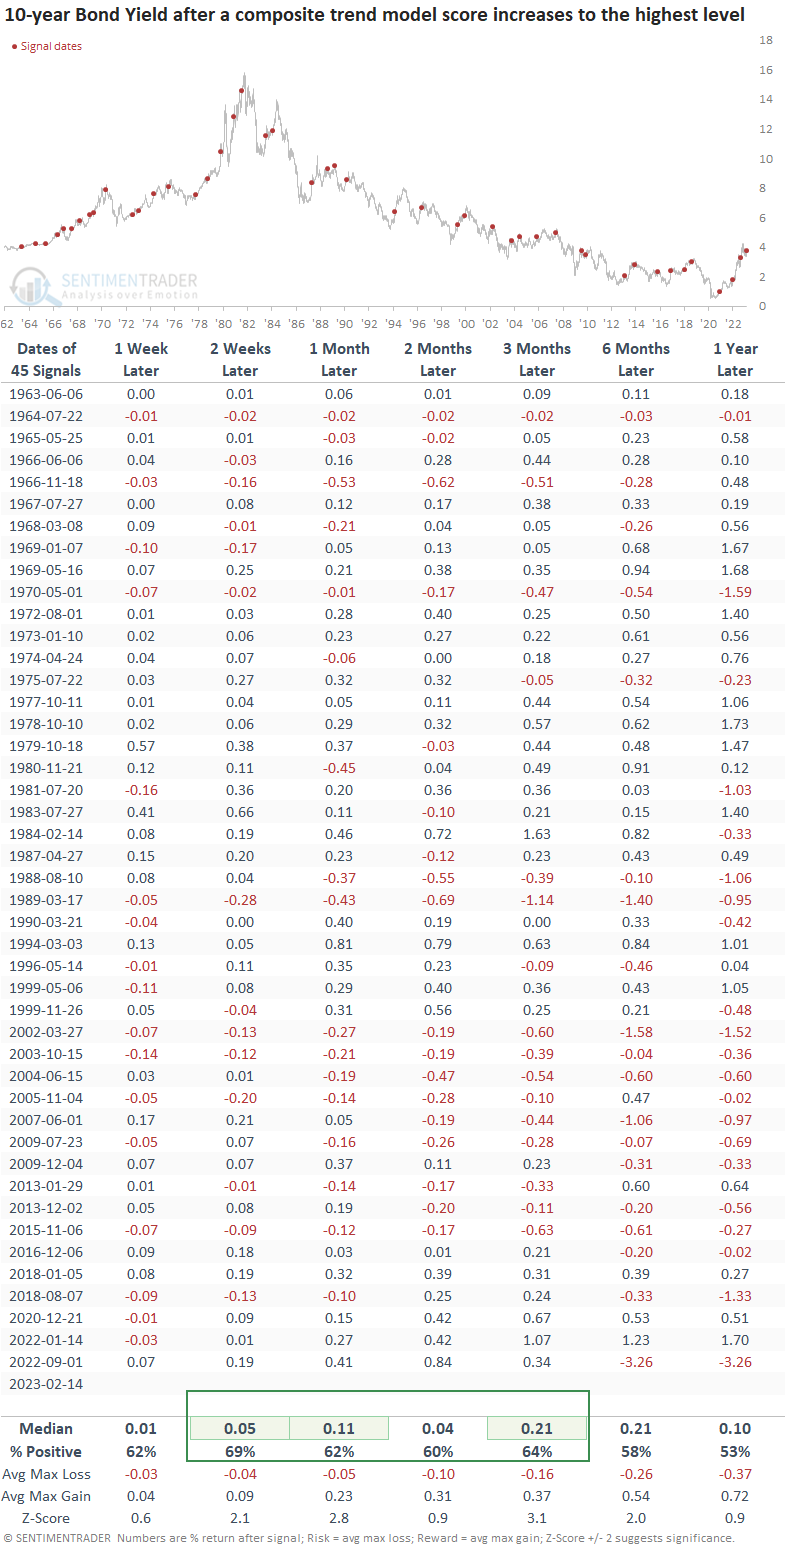
- After similar trend score changes, the 10-year yield was higher two weeks later, 69% of the time
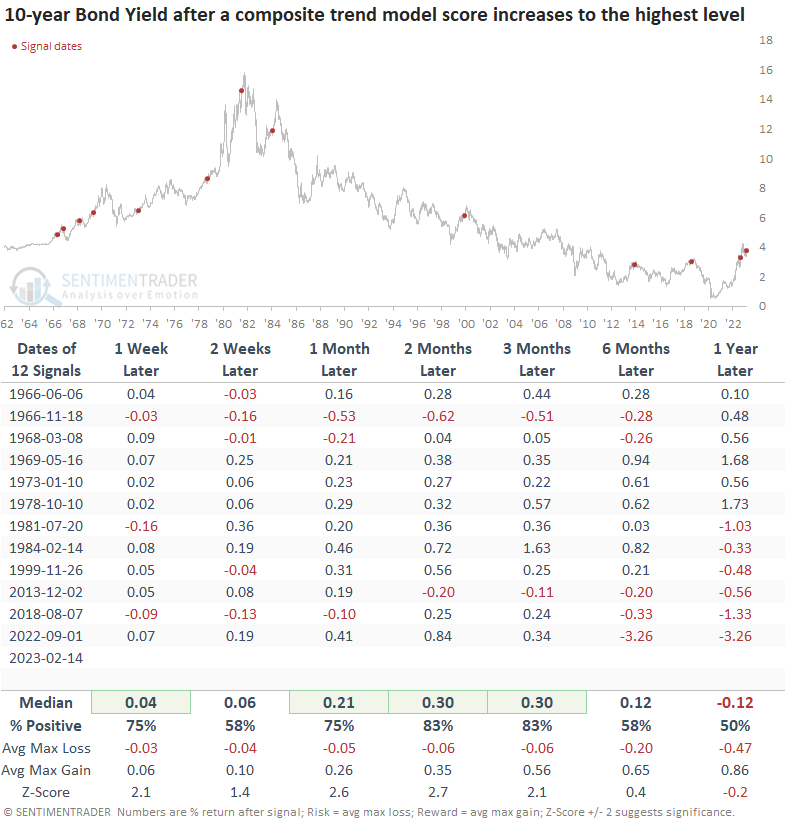
- If I tighten the parameters for the signal, the 10-year yield was higher two months later, 83% of the time
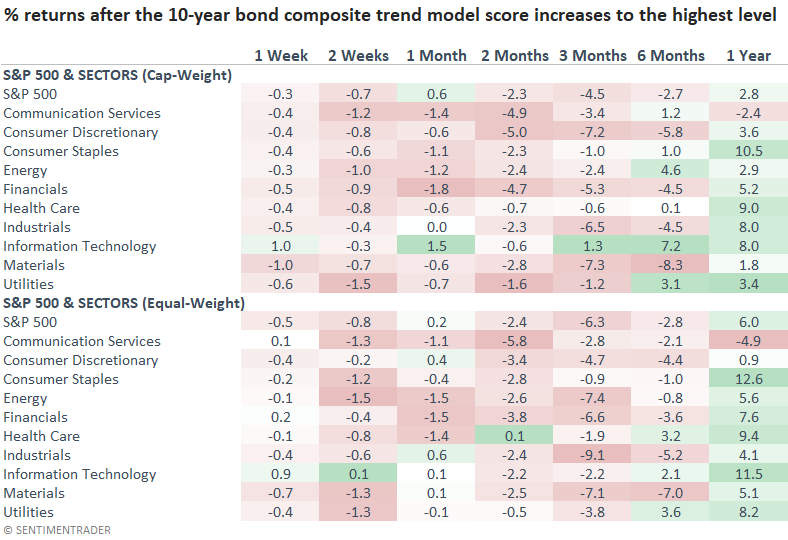
- Stocks could struggle on the resurgence in the uptrend for the 10-year yield
Yields are starting to creep higher again
Over the last four months, the Dollar Index (DXY) declined by 11%, and the 10-year bond yield fell by roughly 88 bps when measured from peak to trough. The easing in the two critical macro factors provided a tailwind for stocks that resulted in a significant rally, especially for cyclical sectors.
A composite that measures the underlying trend for the 10-year bond yield cycled from a score of +2 to +10, reclaiming the highest score possible for a model that ranges from +10 to -10. So, every trend following indicator in the model is bullish.
Let's assess the outlook for bonds and stocks after the composite cycles from a reading of +2 or less to +10.
How the composite trend score works
The composite trend model ranges from +10 highest to -10 lowest. Suppose the indicator maintains the opposite condition to what you see in the table below. In that case, the trend score would equal -1.
- If close > the 50-day average, then the trend score = +1
- If close > the 100-day average, then the trend score = +1
- If close > the 200-day average, then the trend score = +1
- If the 50-day average > the 50-day average (1-day prior), then the trend score = +1
- If the 100-day average > the 100-day average (1-day prior), then the trend score = +1
- If the 200-day average > the 200-day average (1-day prior), then the trend score = +1
- If the 20-day average crosses above the 50-day average, then the trend score = +1
- If the 50-day average crosses above the 200-day average, then the trend score = +1
- If the 49-day Fastk Stochastic > 70, then the trend score = +1
- If close > the highest 126-day close, then the trend score = +1
Similar trend score changes preceded higher yields
When the composite trend model cycles from +2 or less to +10, the 10-year yield tends to rise over the next three months. And win rates are solid, even though many signals occurred during a long secular decline in yields.
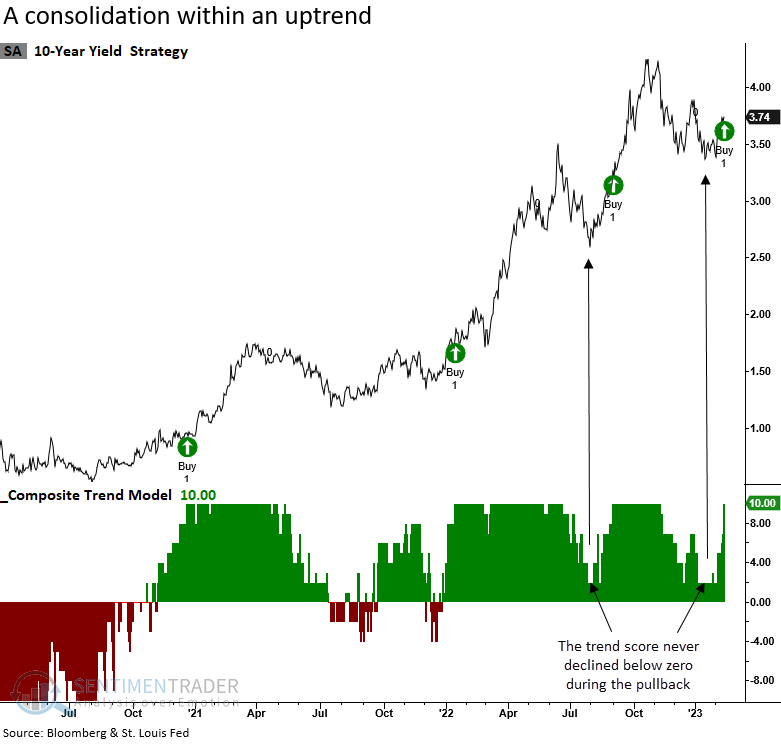
The most recent signal and the one from September 2022 occurred without a trend score reset below zero. i.e., the 10-year yield consolidated within an uptrend. Let's isolate signals when the composite score declines to a range of 0 to +2 and subsequently increases to +10.
When the composite trend score increases to +10 from a range between 0 and +2, the 10-year yield is significantly more likely to rise over short to medium-term time frames. The signal shows an increase in the 10-year at some point in the next three months in all but one case.
Stocks could struggle on the resurgence of the uptrend in the 10-year yield
As we discovered last year, an uptrend in the 10-year yield could pose a problem for stocks on a short to medium-term basis.
What the research tells us...
Stocks have enjoyed the benefit of a falling dollar and declining long-term bond yields since the October 2022 low. However, I see some signs of a potential reversal in both asset classes. In the case of bonds, a composite model that measures the trend strength in the 10-year bond yield surged to the highest trend score reading possible. After similar trend score changes, the 10-year yield tends to rise, and stocks struggle.