
The 10-year to 3-month Treasury yield curve spread inverts

Key points:
- The 10-year to 3-month Treasury yield curve spread inverted
- The inversion occurred after a significant contraction over the last month
- After similar inversions, stocks were flat to slightly negative across most time frames
- Commodities and the yield curve tend to decline over the next three months
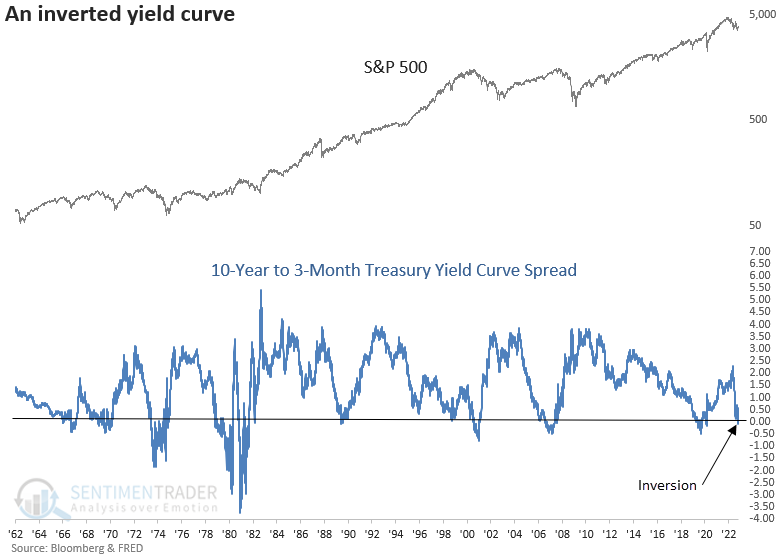
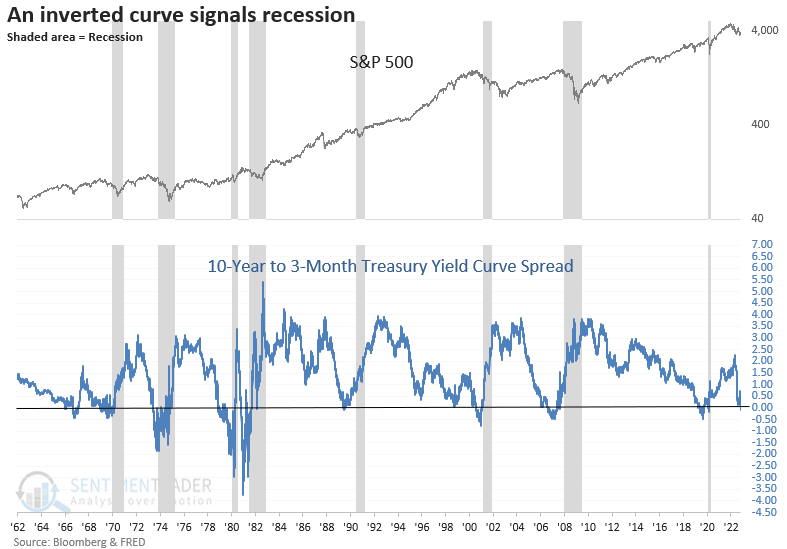
The slope of the yield curve is a closely watched recession predictor
Stocks have enjoyed a nice counter-trend rally since the low on October 12. While the bounce can continue, given positioning, sentiment, and seasonality, one must be mindful of the big-picture macro backdrop.
The Federal Reserve's preferred yield curve spread for calculating the probability of a recession, the difference between the 10-year and 3-Month Treasury securities, inverted last week for the first time since 2019.
With a recession more likely based on the historical record of the yield curve, a resumption of the downtrend is a real risk.
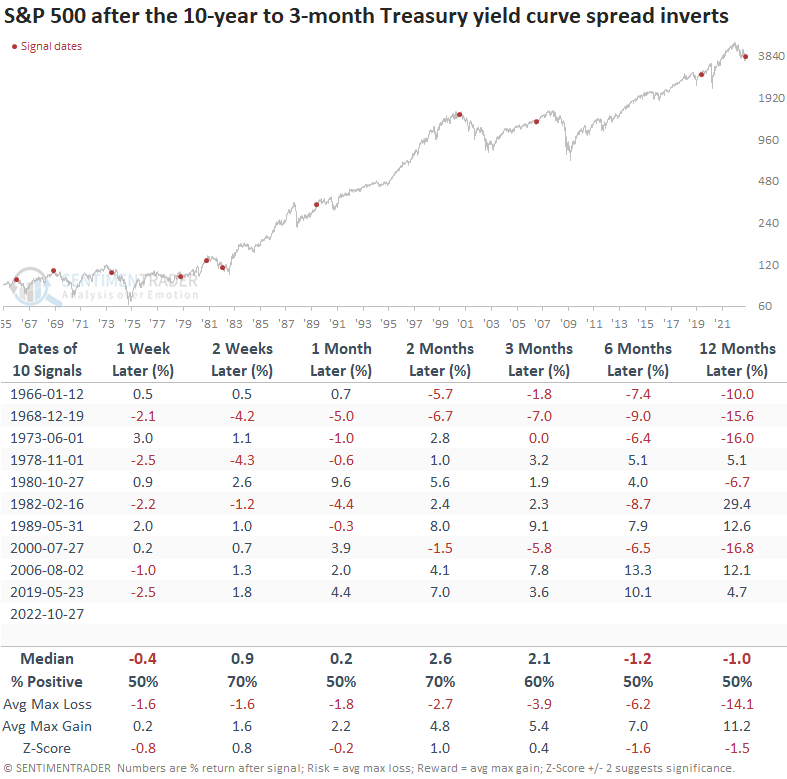
I eliminated repeat signals by identifying the first yield curve inversion after the spread reset above 1%. If the S&P 500 registered a new 252-day high after an inversion, I included a second signal as long as the spread condition was achieved, which was the case in 1982, but not 1974.
The current yield curve inversion signal occurred with the S&P 500 down 20.62% from its high, representing the worst drawdown in history.
Suppose an inversion occurred during a bear market. In that case, the average number of days to a recession was 123. In contrast, if a signal occurred during a bull market, the average number of days was 208.

Similar signals preceded flat to slightly negative returns for the S&P 500
Stocks struggle after yield curve inversions with mostly flat to negative returns across all time frames. Based on the comparison table, I'm keeping an eye on the 1973 analog. At the time of the curve inversion, the FOMC had increased rates four times, and the S&P 500 was down 13%. The S&P 500 was flat for three months but weakened after three additional hikes and a recession signal.
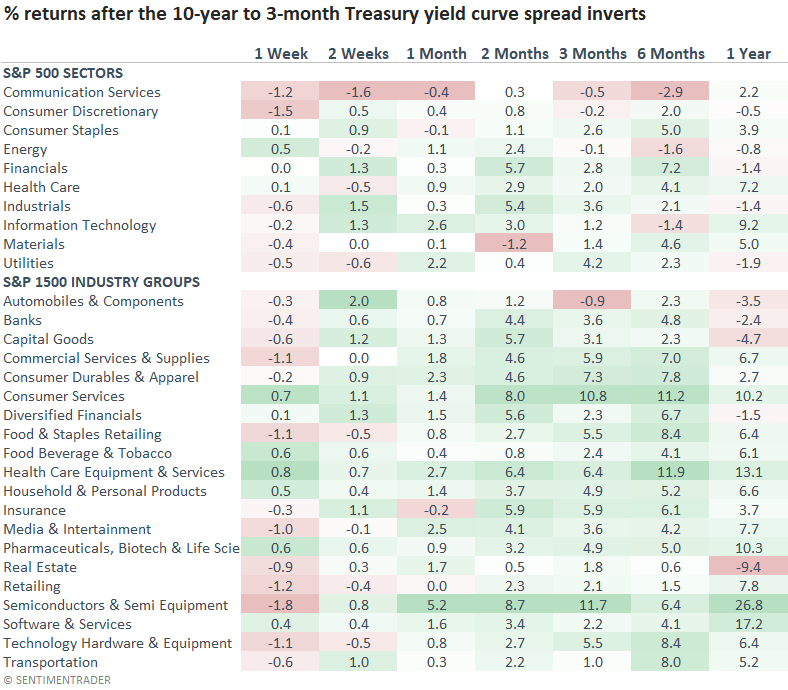
Consumer staples and health care, two defensive sectors, show the most consistent returns across all time frames. The yield curve slope weighed on cyclical and interest rate-sensitive groups.
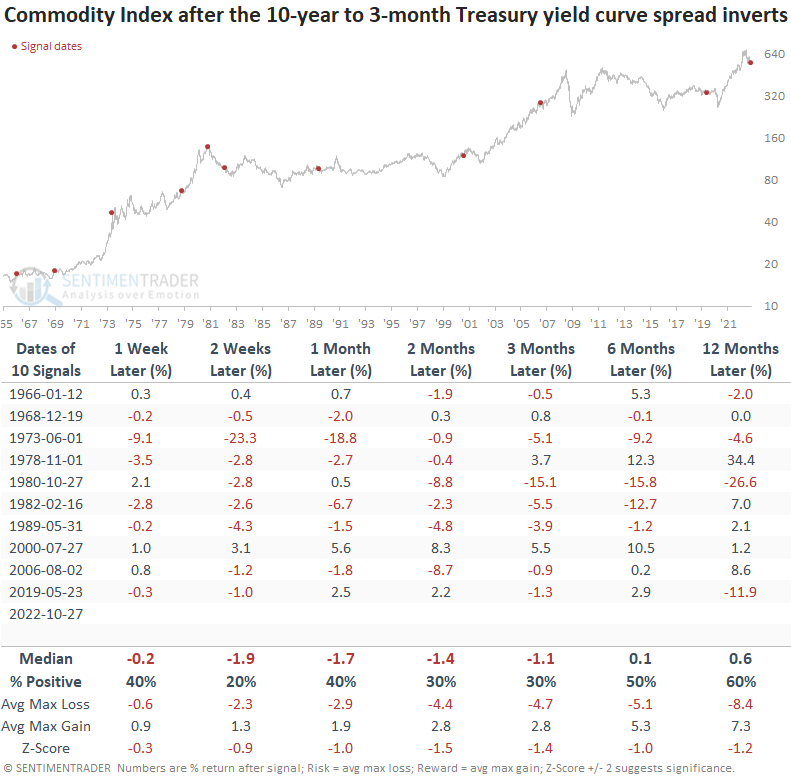
The Bloomberg Spot Commodity Index shows negative to flat returns across all time frames. With a yield curve inversion signaling weaker economic activity, one needs to be careful with an allocation to a broad basket of commodities.
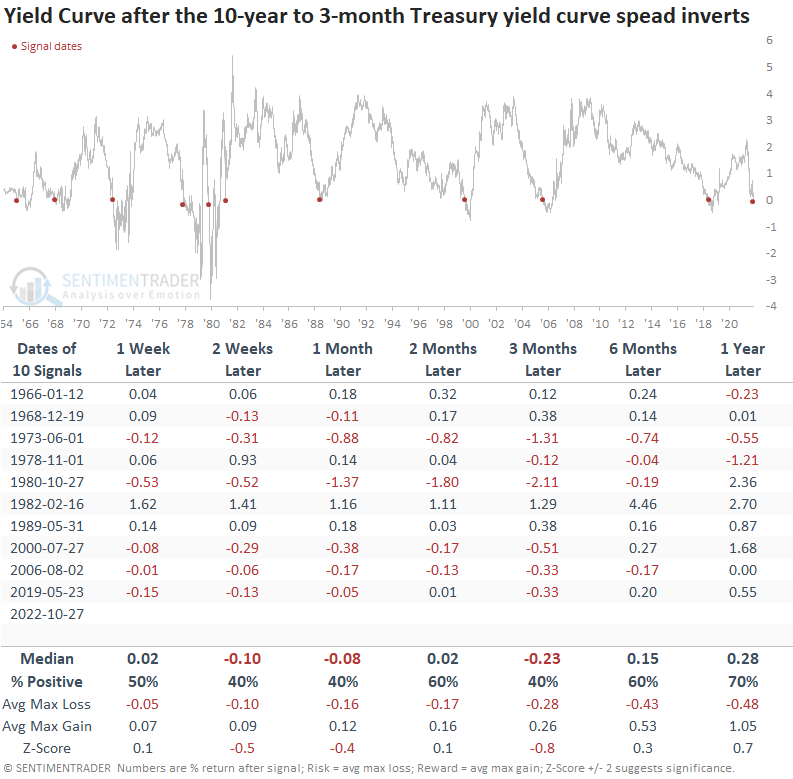
The yield curve should continue to flatten over the next three months. However, the 6 to 12-month outlook suggests the Fed Reserve will eventually reverse course, and the curve will steepen.
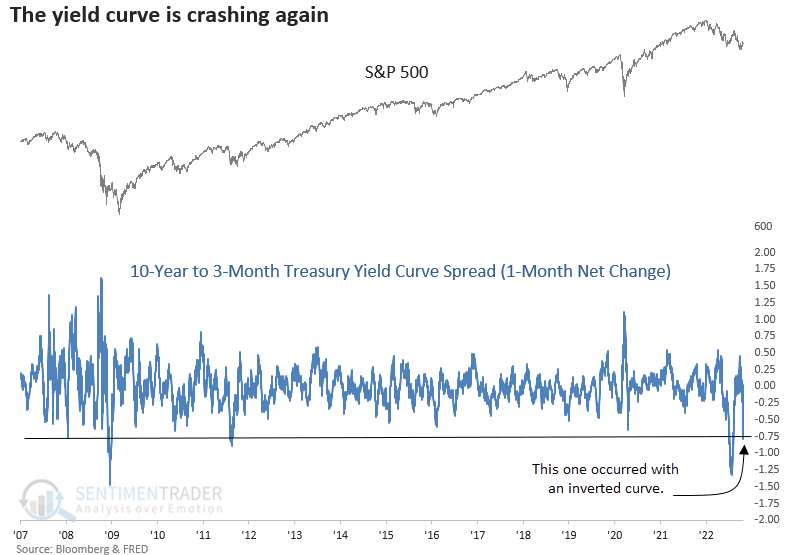
The yield curve crashed over the last month
For the first time since 1981, the 1-month net change for the Treasury yield curve spread has fallen by over 75 bps with an inverted curve.
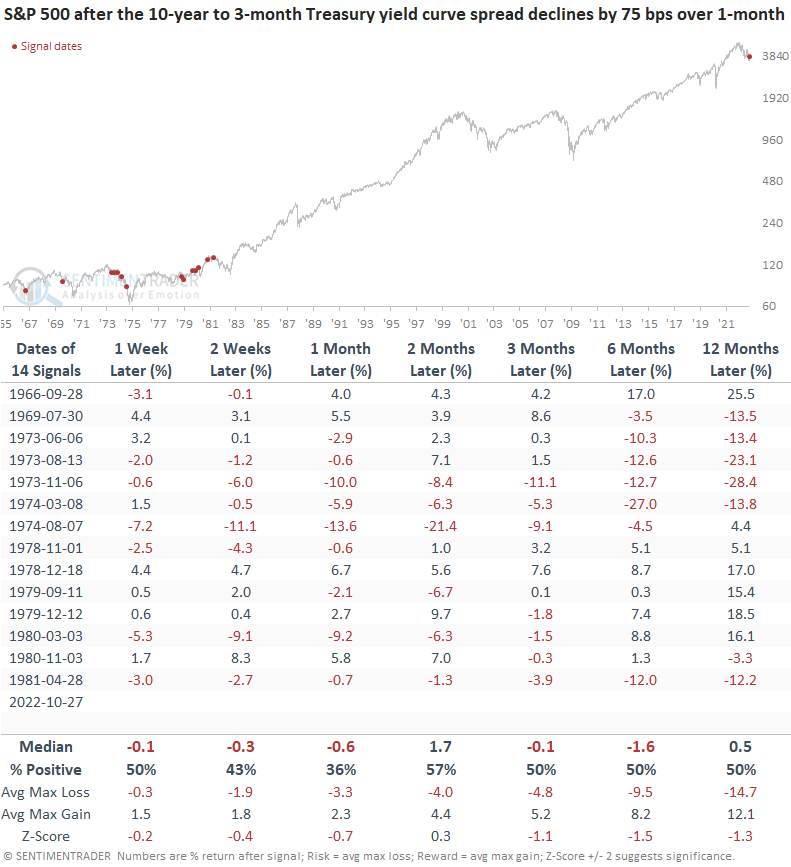
S&P 500 returns, win rates, and z-scores are unfavorable when the yield curve crashes, and the curve is inverted. Until last week, significant contractions with an inversion had only occurred during the 1966-82 secular bear market.
What the research tells us...
The 10-year to 3-month Treasury yield curve spread spectacularly inverted last week, crashing by over 75 bps in a month. A collapse of this magnitude hasn't occurred in more than 40 years. While stocks can continue to grind higher in the near term, one must be mindful of the big-picture backdrop, which doesn't look constructive based on the historical record of an inverted yield curve. Commodities will also struggle in this environment, and the slope of the curve could continue to flatten.