
The 10-and-10 pullback with no exhaustive selling, but extreme sentiment

Key points:
- The S&P 500 has gone 10 weeks and is 10% into a drawdown, which has preceded rallies every time
- Despite the losses, there have been no days with truly exhaustive selling pressure
- The persistent decline has caused Smart Money Confidence to spike to an extremely high level
The S&P 500's "10-and-10" pullback
It's been less than 3 months, but it feels much longer. As investors heralded the end of 2021, stocks were sitting at all-time highs, and the outlook (according to most) was excellent.
Now 10 weeks removed from the last weekly closing high in the S&P 500, the most benchmarked index in the world is still sitting more than 10% below its high point. Buyers' apathy and inability to build on even minor rallies is a hallmark of bear markets, and that fear is building by the day.
However, from price action alone, it's not clear that's where we're headed. So far, there haven't been any truly extreme price swings during this pullback, and 10-week, 10% drawdown corrections in the S&P's history haven't proven to be harbingers of doom. Far from it - the index rallied during the next few months after every "10-and-10" pullback.
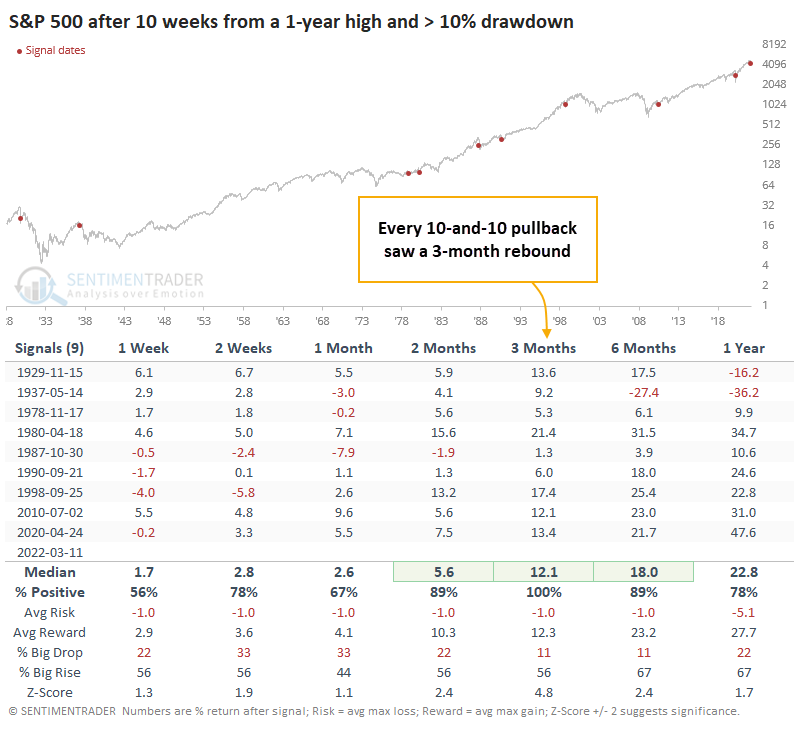
While a few of the signals preceded further drawdowns of more than 5% within the next 3 months, only the aftermath of the '87 crash saw risk outweigh reward.

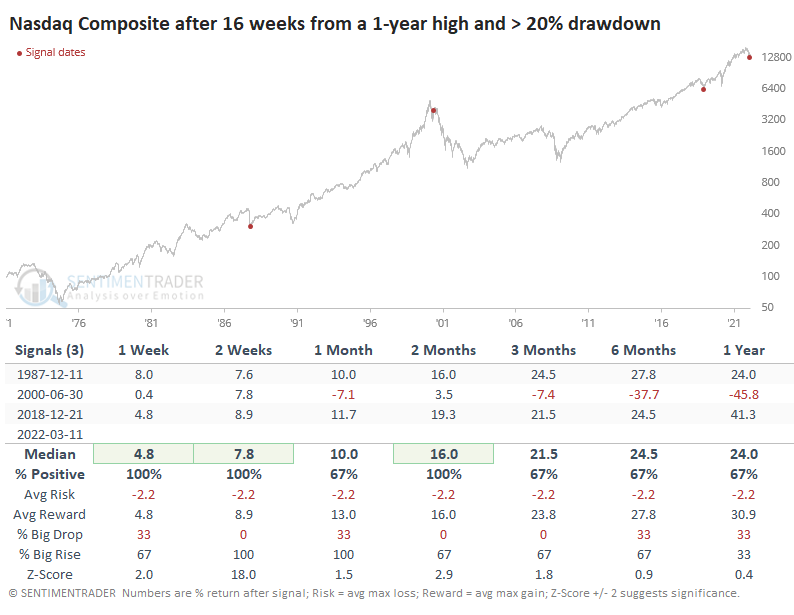
It's been an even nastier stretch for the Nasdaq Composite. Remarkably, this is only the 4th time in that index's history when it's gone 16 weeks from its high and was more than 20% off its peak at the time. Again, all 3 preceded short- to medium-term rallies, though bears will undoubtedly note that this also occurred at the peak of the internet bubble, to which there are more than a few apt comparisons.
Despite the pullback, no exhaustive selling pressure
Curiously, there have been no days with truly exhaustive selling pressure during this entire stretch.
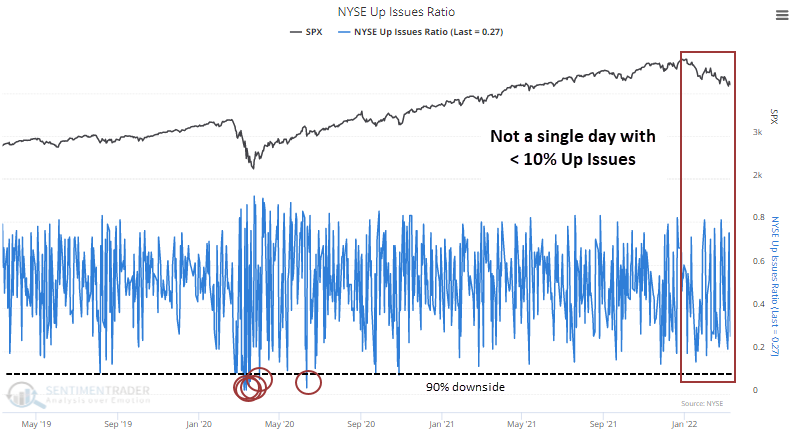
Despite the large (but not extreme) price swings, there have been zero days with more than 90% selling pressure. The NYSE Up Issues Ratio has remained above 10% the entire time, unlike the pandemic crash and its aftermath.
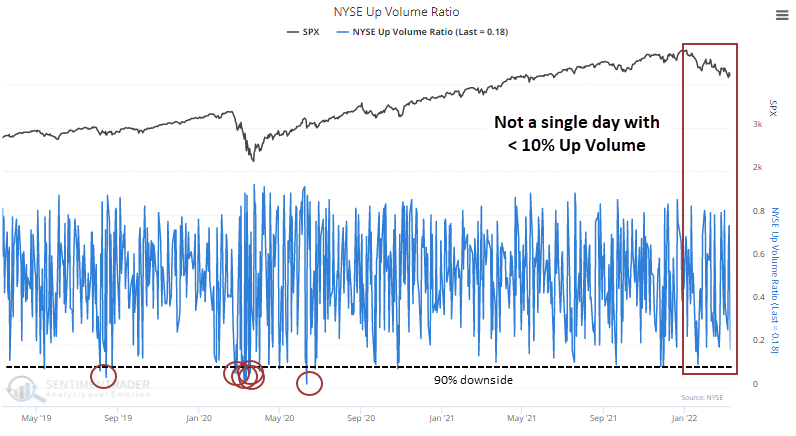
Volume is more volatile, but even so, there haven't been any days with less than 10% Up Volume.
The suggestion is that investors are relatively complacent. Despite heavy and persistent losses, we haven't yet seen a whoosh of panic selling pressure, something that always piques the interest of contrarians. While such behavior would certainly help more metrics reach compelling oversold levels, it's not necessarily required.
The table below shows every time the S&P 500 went 47 days into at least a moderate pullback, but there were no days with more than 90% selling pressure in issues or volume.
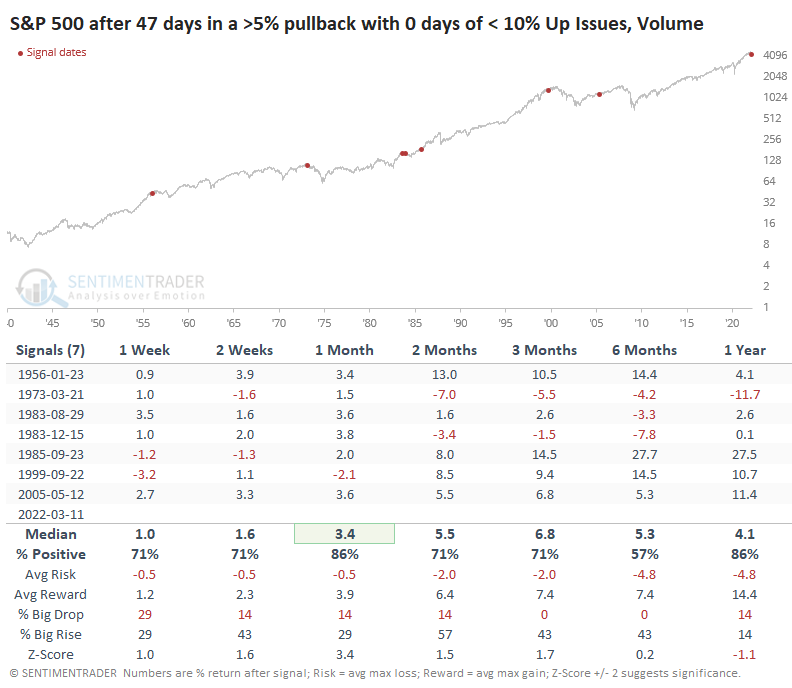
The sample size is tiny, as we typically see at least a single session when investors all-out panic. While a couple of the precedents led to bear markets, it took a long time, and the S&P tended to rebound - or chop around at worst - for several months.
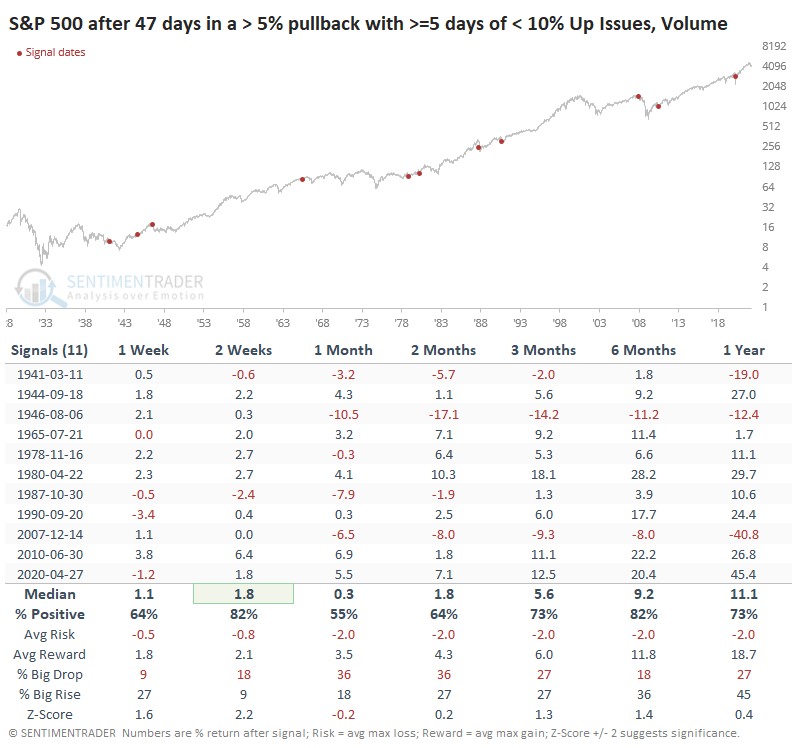
Contrast that with pullbacks when there were many exhaustive selling pressure days. Short-term returns were significantly worse during those markets as the days with heavy selling made investors nervous about stepping in. Long-term returns were quite a bit better than the "mild" pullbacks, but also with more instances of big drops.
Shifting from weak to strong hands
The persistent selling pressure is causing sentiment to stay weak. Or rather, weak sentiment is causing rally attempts to falter quickly: chicken and egg.
At least some investors seem to be stepping up. With commercial hedgers covering some of their historic short positions against major equity index futures, Smart Money Confidence has been able to rise. It has now surpassed the peak from the pandemic.
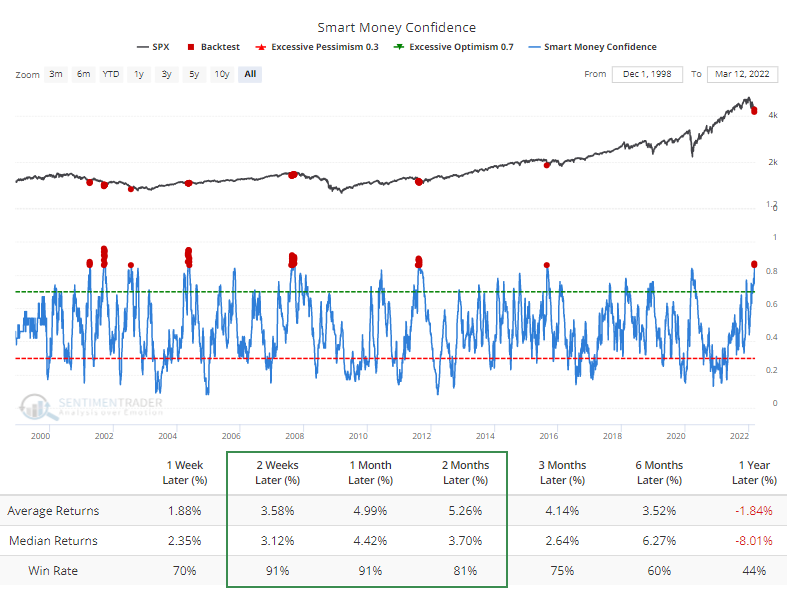
According to the Backtest Engine, the S&P 500 rallied during the next 2-4 weeks after 52 out of 57 days when the Smart Money was more than 85% confident in a rally.
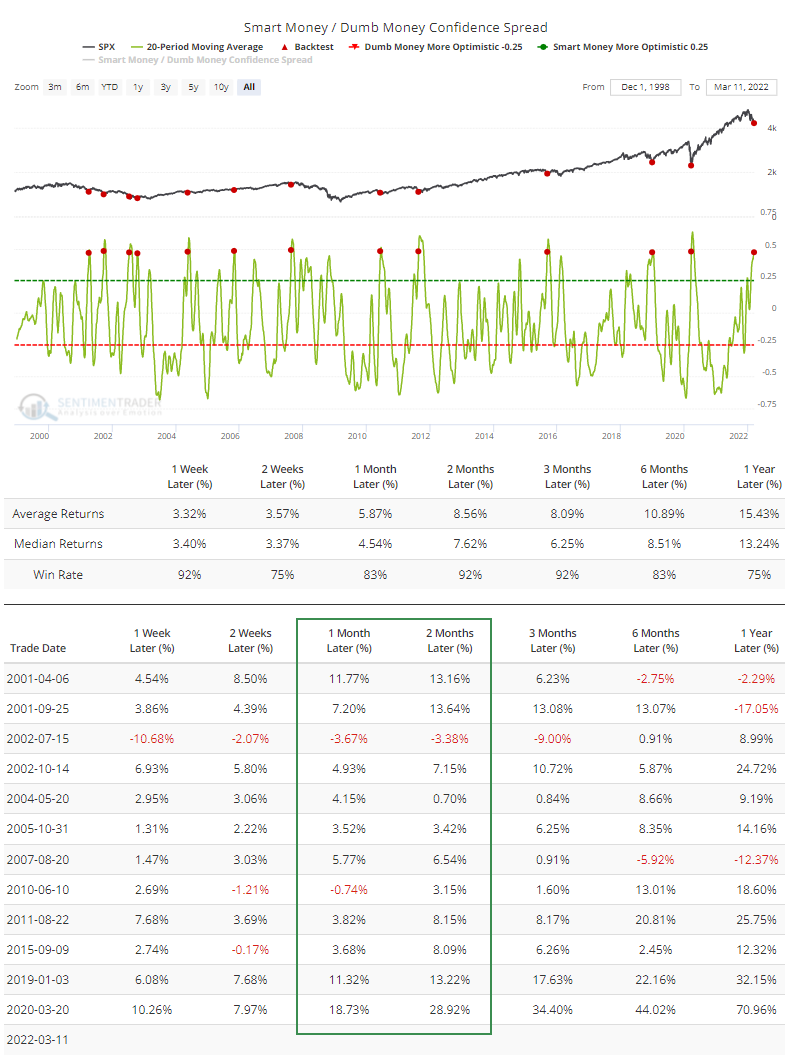
As Jay recently noted, the spread between Smart and Dumb Money has been wide for a while, and the 20-day average just crossed above 47%. Again, the Backtest Engine shows excellent short- to medium-term returns after similar behavior.
What the research tells us...
Basically, every metric I use to gauge the market environment is negative. For all intents and purposes, that requires truly extreme sentiment readings to have any confidence in a multi-week to multi-month rebound. There are always some outliers, but fewer than 10% of core indicators are in risk-on mode, and more than a third of a broader range of indicators have been in extreme pessimism territory. We're seeing ample evidence of extremes, but not panic. Maybe we need that one final flush that finally triggers it. That would make a case for a sustained rebound easier from a contrary point of view. The tricky part is that a final flush is unnecessary for that rebound to occur.