
Testing Unemployment Rate Breadth
The Simple Trading Model With Fundamentals uses the Unemployment Rate as a buy/sell signal filter. However, I've seen various people over the past year use a variation of the Unemployment Rate - the Unemployment Rate's breadth.
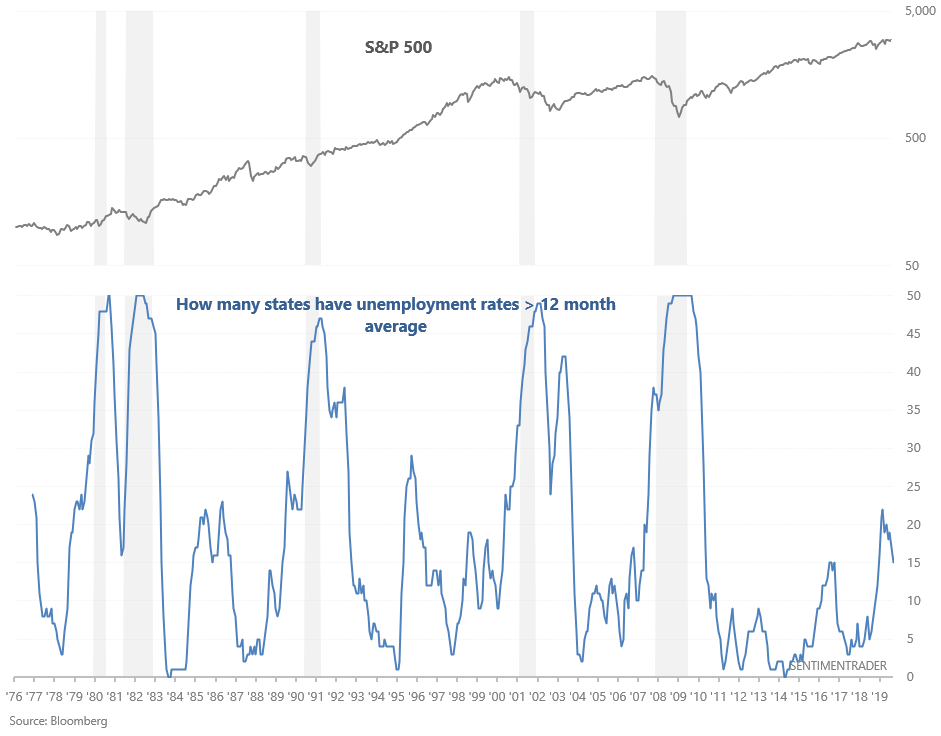
My version of the Unemployment Rate's breadth looks at how many states' unemployment rates are above their respective 12 month averages.
Some market watchers consider this breadth metric to be useful because deterioration in the unemployment rate's breadth often happens before the overall U.S. unemployment rate deteriorates. Looking at the above chart, it's clear that this figure trends upwards before recessions begin (with several false signals, e.g. 1985-1986, 1995, 2016). But how useful is this from a market timing perspective? Is this significantly better than the U.S. unemployment rate on its own? The Simple Trading Model With Fundamentals yields:
- Model: 8.37% per year
- Model (long/short): 9.25% per year
- Model (Aggregate Bonds): 11.49% per year
- Model (Corporate Bonds): 10.92% per year
- Model (Treasury Bonds): 10.95% per year
- Model (Gold): 11.03% per year
The optimal "danger zone" for Unemployment Breadth is when the "# of states with unemployment rates above their respective 12 month averages" exceeds 20. I.e. the new model becomes:
Model’s rules
- Buy and hold the S&P 500 (nontotal return index) if the S&P 500 is >= its 12 month moving average, OR the "# of states with unemployment rates <= their respective 12 month moving averages" <= 20.
- Otherwise, SELL.
You can do 1 of 6 things when you SELL:
- Model: Shift into 100% cash
- Model (long/short): Short the S&P 500 Total Return Index
- Model (Multi-Asset Aggregate Bonds): Buy and hold the Bloomberg Barclays US Aggregate Bond Total Return Index
- Model (Multi-Asset Corporate Bonds): Buy and hold the Bloomberg Barclays US Corporate Bond Total Return Index
- Model (Multi-Asset Treasury Bonds): Buy and hold the Bloomberg Barclays US Treasury Bond Total Return Index
- Model (Gold): Buy gold
Performance
- Last updated September 2019
- Historical returns do not include dividends reinvested. Including dividends reinvested, historical returns would be higher by an average of 2% per year.
- Using leveraged ETFs like SSO (2x) and UPRO (3x) will increase your returns and drawdowns
- Shorting the S&P is done by buying inverse ETFs
- Historical returns do not account for transaction costs, slippage, and bid-ask spreads
Model: 9.3%
Average Annual Return
- January 1977 – September 2019: buy and hold = average annual return of 8.22%
- January 1977 – September 2019: model = average annual return of 9.3%. That’s 1.08% more than buy and hold
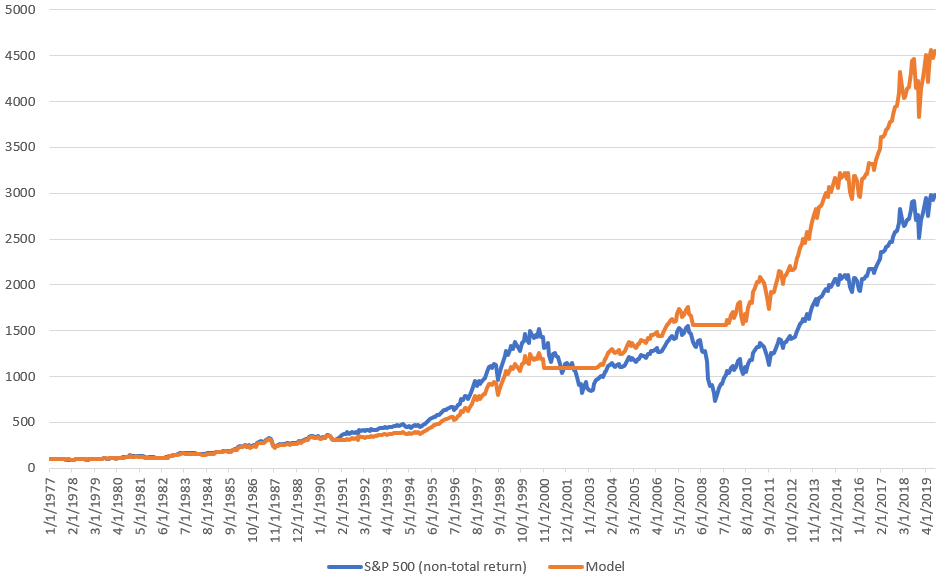
Linear Performance Chart
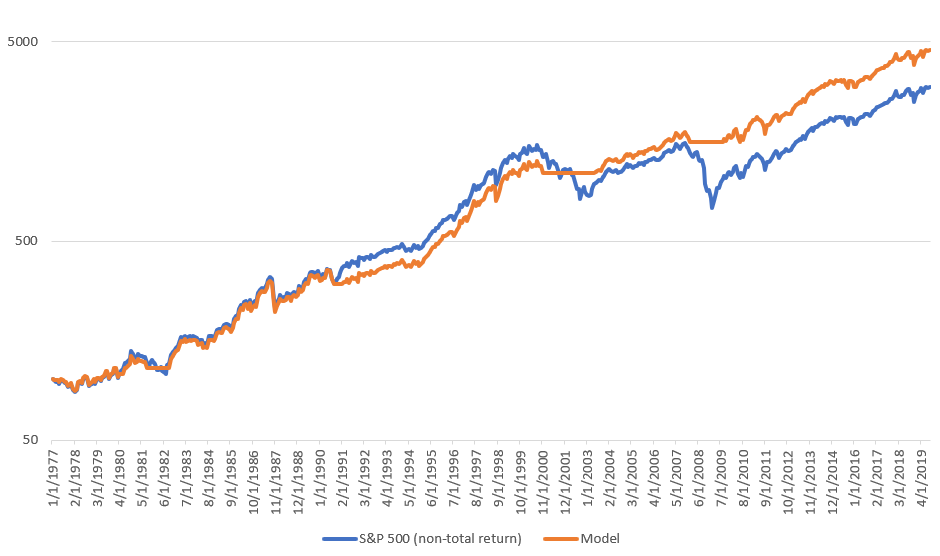
Log Scale Performance Chart
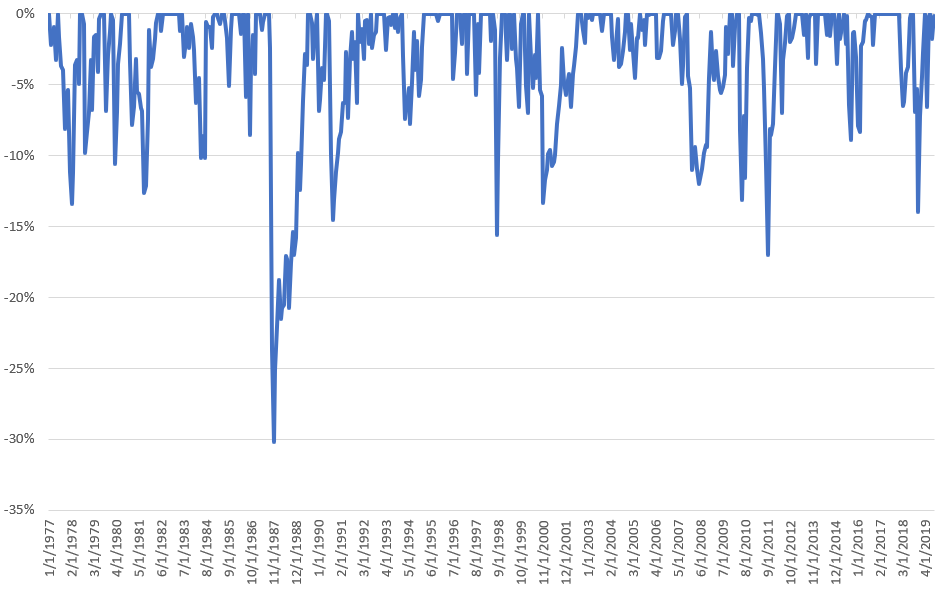
Maximum Drawdown Chart
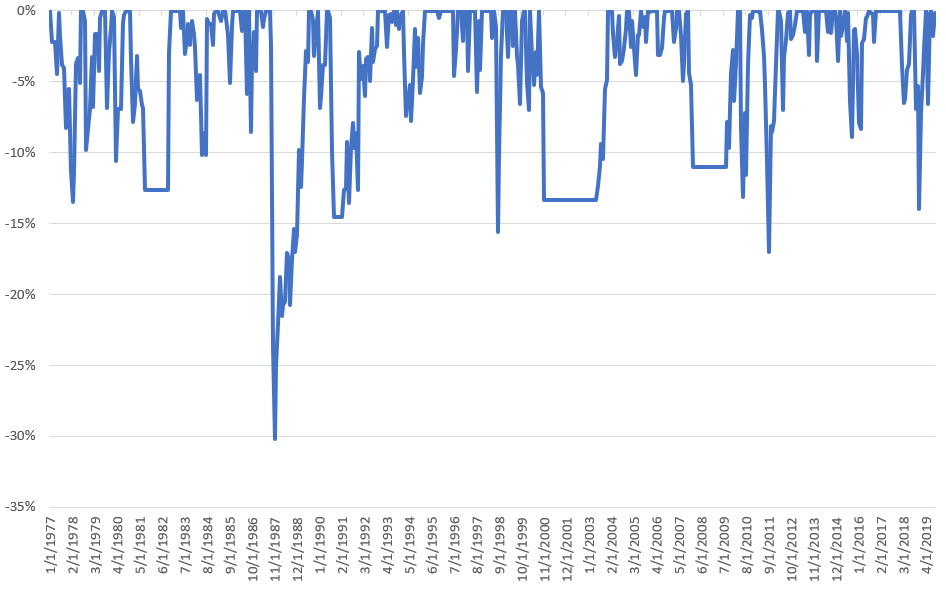
Maximum Drawdown = -30.16%
Maximum Drawdown / Average Annual Return ratio = 3.24
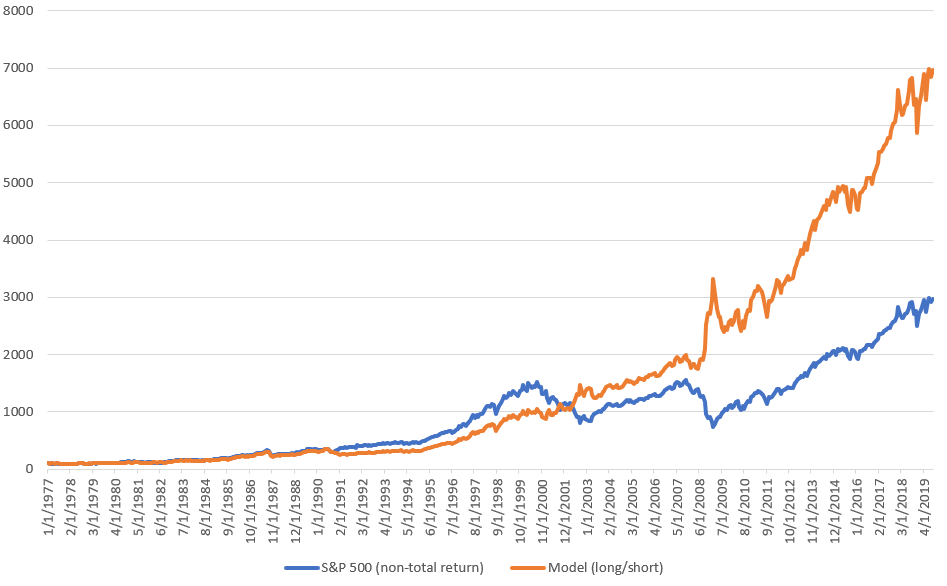
Model (long/short): 10.4%
Average Annual Return
- January 1977 – September 2019: buy and hold = average annual return of 8.22%
- January 1977 – September 2019: model = average annual return of 10.4%. That’s 2.17% more than buy and hold
Linear Performance Chart
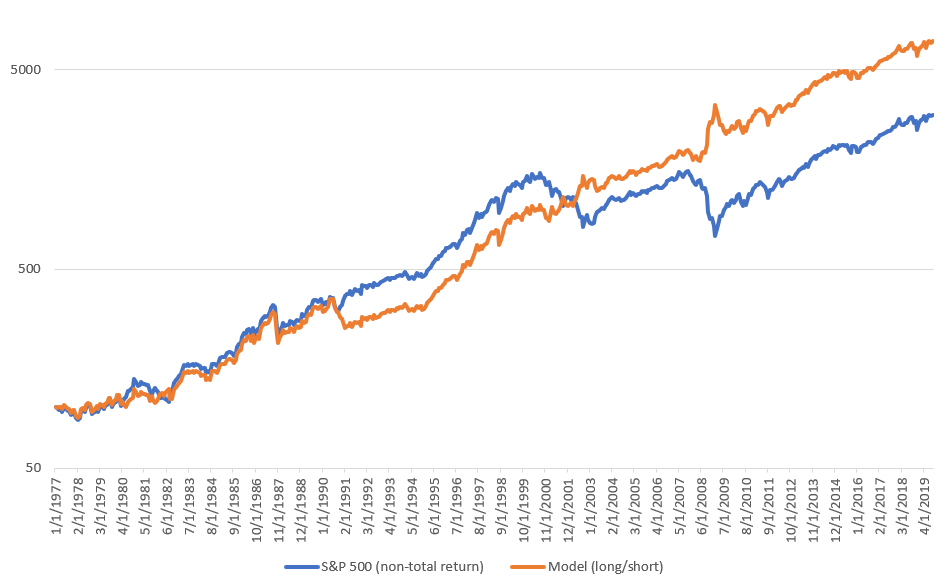
Log Scale Performance Chart
Maximum Drawdown Chart
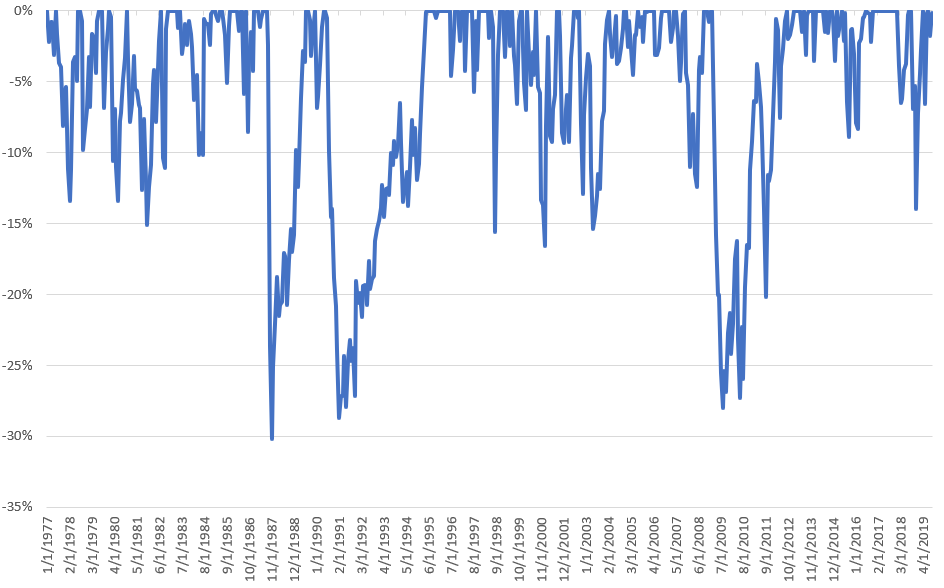
Maximum Drawdown = -30.16%
Maximum Drawdown / Average Annual Return ratio = 2.9
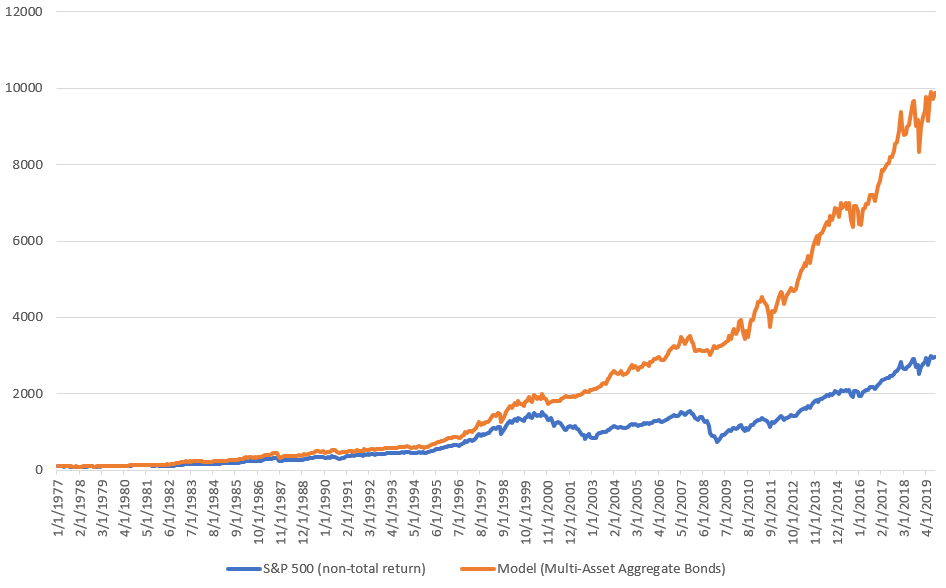
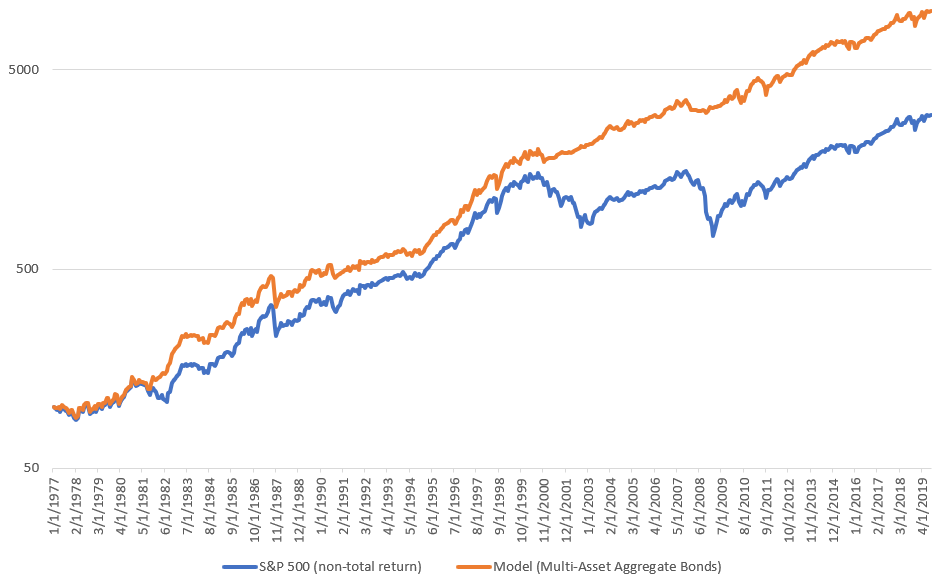
Model (Multi-Asset Aggregate Bonds): 11.3%
Average Annual Return
- January 1977 – September 2019: buy and hold = average annual return of 8.22%
- January 1977 – September 2019: model = average annual return of 11.3%. That’s 3.08% more than buy and hold
Linear Performance Chart
Log Scale Performance Chart
Maximum Drawdown Chart
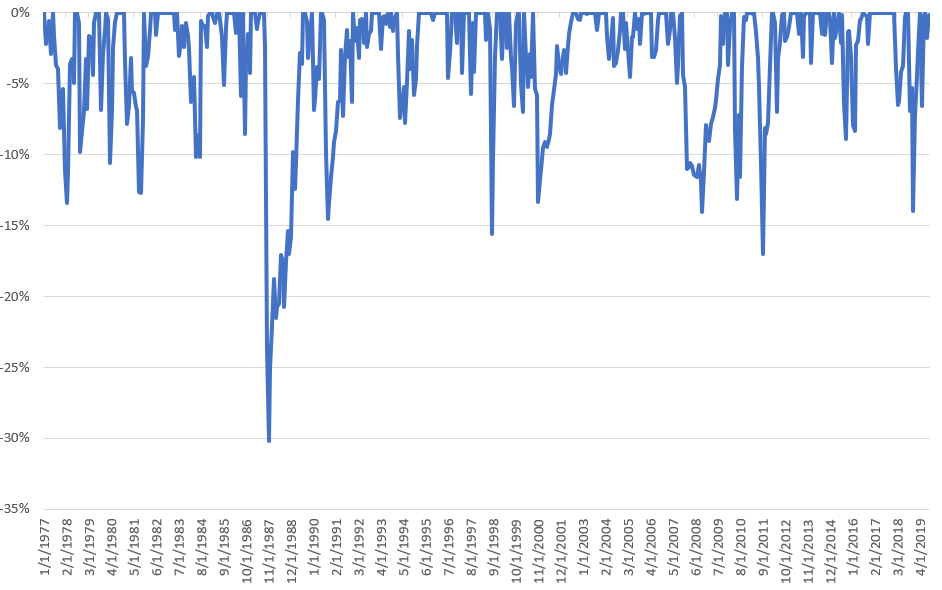
Maximum Drawdown = -30.16%
Maximum Drawdown / Average Annual Return ratio = 2.66
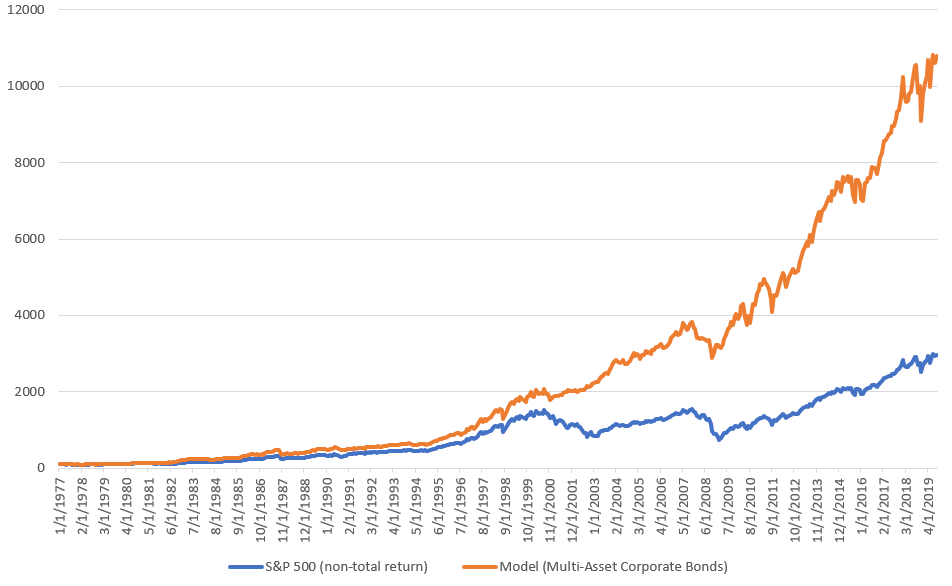
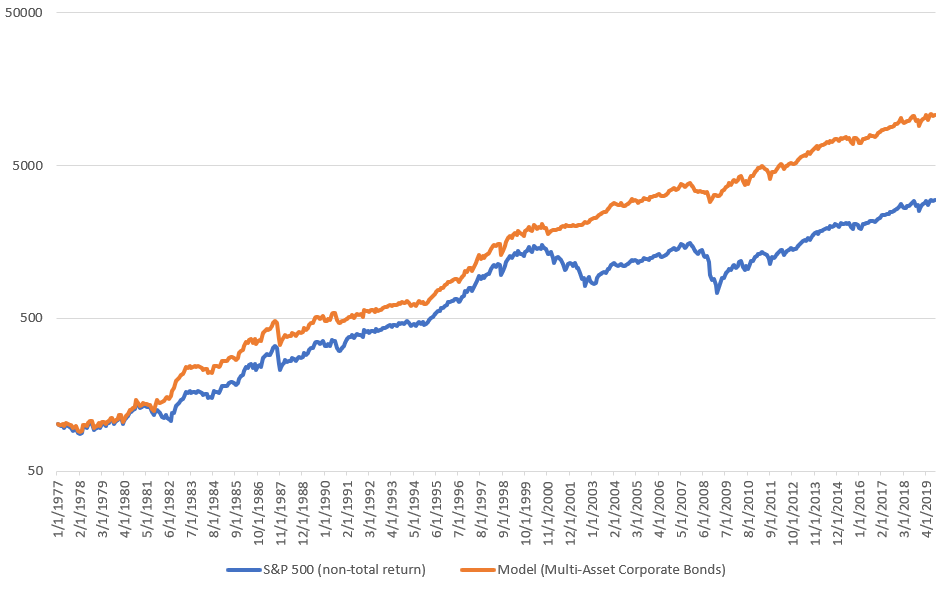
Model (Multi-Asset Corporate Bonds): 11.53%
Average Annual Return
- January 1977 – September 2019: buy and hold = average annual return of 8.22%
- January 1977 – September 2019: model = average annual return of 11.53%. That’s 3.31% more than buy and hold
Linear Performance Chart
Log Scale Performance Chart
Maximum Drawdown Chart
Maximum Drawdown = -30.16%
Maximum Drawdown / Average Annual Return ratio = 2.61
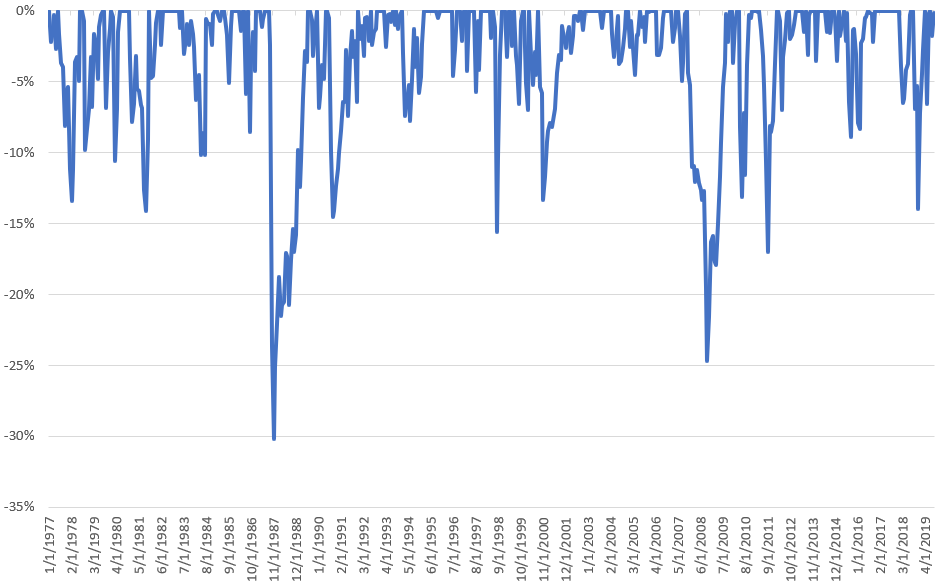
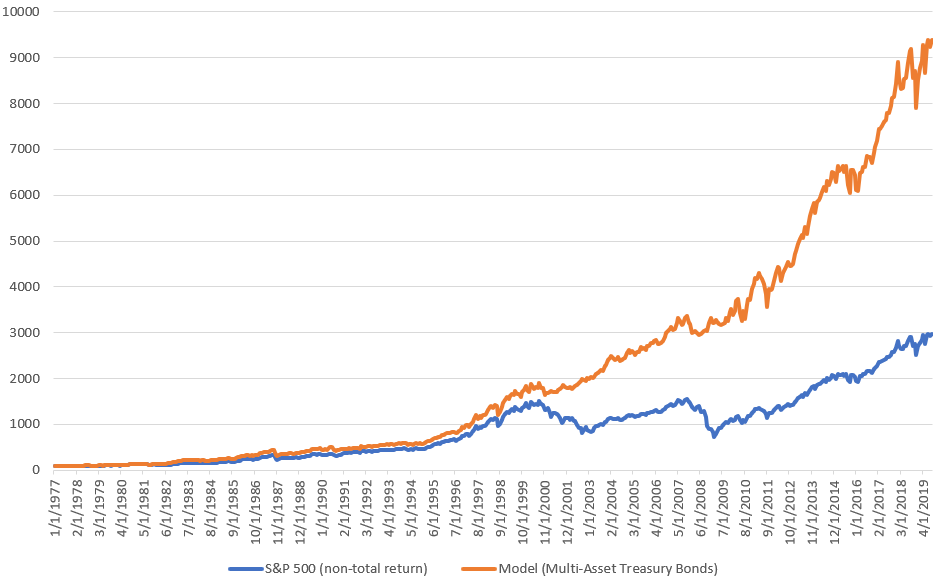
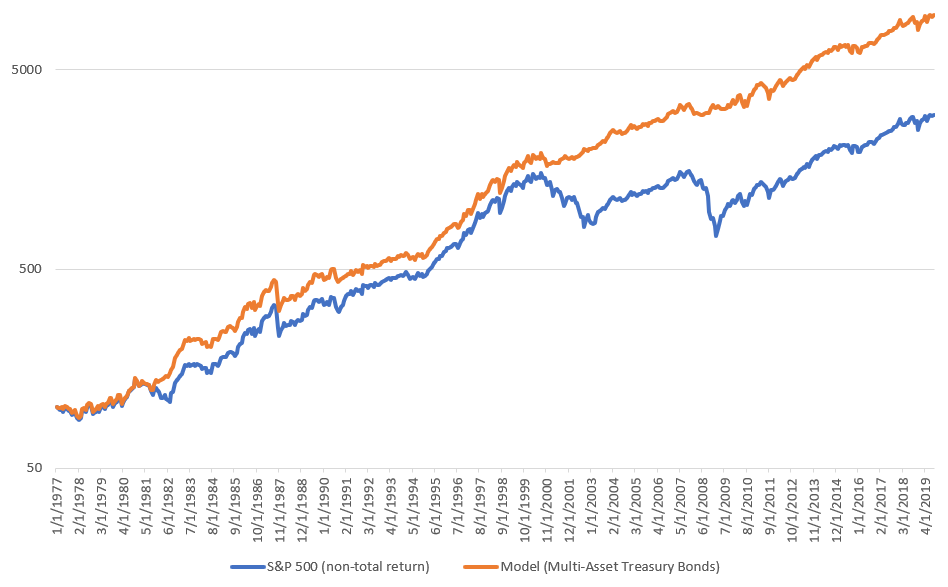
Model (Multi-Asset Treasury Bonds): 11.17%
Average Annual Return
- January 1977 – September 2019: buy and hold = average annual return of 8.22%
- January 1977 – September 2019: model = average annual return of 11.17%. That’s 2.94% more than buy and hold
Linear Performance Chart
Log Scale Performance Chart
Maximum Drawdown Chart
Maximum Drawdown = -30.16%
Maximum Drawdown / Average Annual Return ratio = 2.7
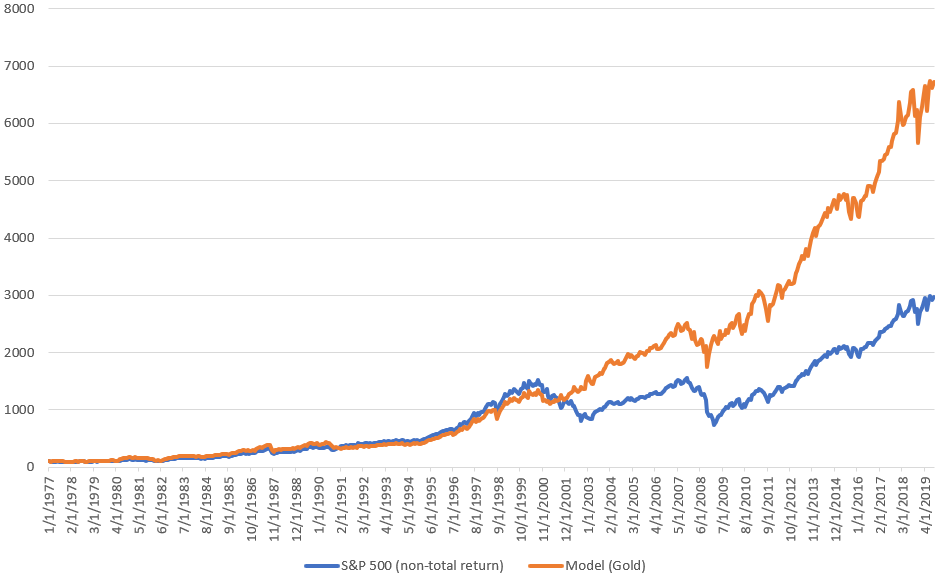
Model (Gold): 10.3%
Average Annual Return
- January 1977 – September 2019: buy and hold = average annual return of 8.22%
- January 1977 – September 2019: model = average annual return of 10.3%. That’s 2.08% more than buy and hold
Linear Performance Chart
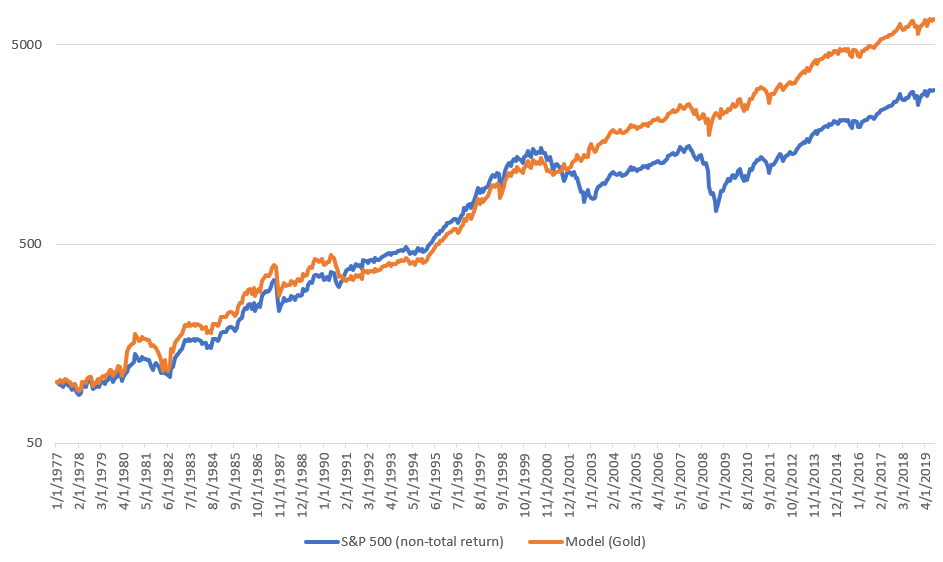
Log Scale Performance Chart
Maximum Drawdown Chart
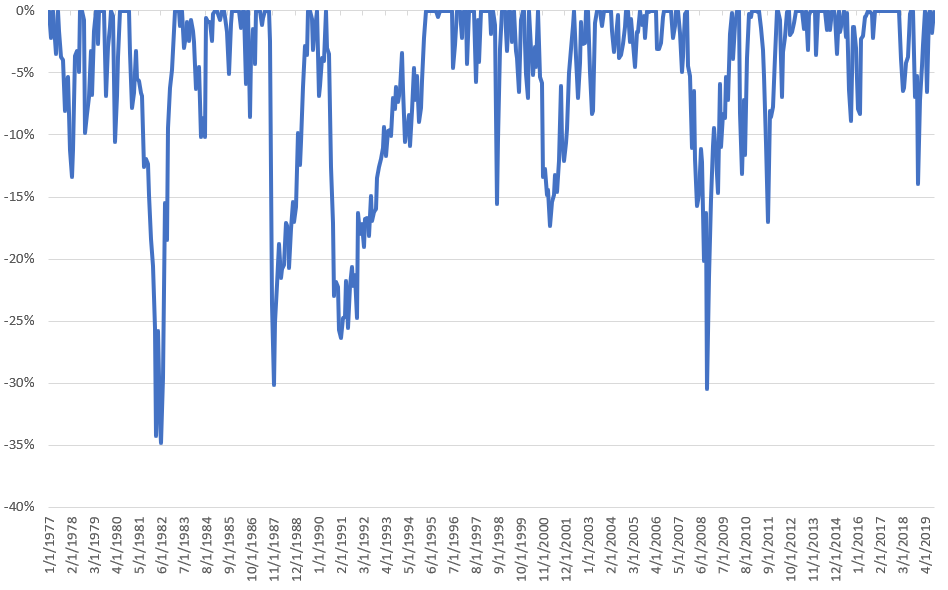
Maximum Drawdown = -34.79%
Maximum Drawdown / Average Annual Return ratio = 3.37
Conclusion
As you can see, Unemployment Breadth is an interesting indicator to monitor since it deteriorates before the overall U.S. unemployment rate deteriorates. However, many cases in which Unemployment Breadth deteriorates are false bearish alarms. So using Unemployment Breadth in an end-to-end model yields performance that is not significantly better than that of the U.S. unemployment rate.